
Journal of Clinical Images and Medical Case Reports
ISSN 2766-7820
Research Article - Open Access, Volume 5
The relationship of postural asymmetry to inspiratory and expiratory pressure of young women
Sławomir Paśko1; Marek Sutkowski2*; Tomasz Grudniewski3; Beata Żuk4
1Institute of Micromechanics and Photonics, Warsaw University of Technology, Warsaw, Poland.
2Institute of Microelectronics and Optoelectronics, Warsaw University of Technology, Nowowiejska 15/19, 00-665 Warsaw, Poland.
3Faculty of Technical Sciences, State School of Higher Education, Sidorska 95/97, 21-500 Biała Podlaska, Poland.
4Department of Biophysics and Human Physiology, Medical University of Warsaw, Chałubińnskiego 5, 02-004 Warsaw, Poland.
*Corresponding Author : Marek Sutkowski
Institute of Microelectronics and Optoelectronics, Warsaw University of Technology, Nowowiejska 15/19, 00-665 Warsaw, Poland.
Tel: +48-22-234-77-80 & +48-22-234-5349;
Email: marek.sutkowski@pw.edu.pl
Received : Sep 27, 2024
Accepted : Oct 21, 2024
Published : Oct 28, 2024
Archived : www.jcimcr.org
Copyright : © Sutkowski M (2024).
Abstract
Introduction: Breathing mechanic is determined by tonus and flexibility, correct contraction amplitude of the thoracic diaphragm, relaxation, and the activity of auxiliary muscles. Respiratory muscle strength is evaluated by measuring the static Maximal Inspiratory (MIP) and Expiratory (MEP) pressures. The aim of this research was to determine the relationship between MIP and MEP and body posture in female soccer players.
Material and methods: The research involved a group of 57 women aged 16-20 years (42 soccer players and 15 controls) without disorders in the movement apparatus, cardiovascular system, or respiratory system. MIP and MEP were measured and analyzed with respect to body posture in three different positions. MIP and MEP values were evaluated with Micro Respiratory Muscle Analyzer (CareFusion). The body posture in the coronal plane from the back measured with a non-contact 3D photogrammetry system.
Results: Asymmetries in body posture were also measured and compared between groups. Asymmetry was observed at all anatomical locations in each of the postural positions, with an increase in asymmetry of the scapulae in the soccer players (p=0.008). The control group had increased asymmetry at the skull nuchal line.
Conclusion: These results draw attention to the need for standardizing the evaluation procedure for respiratory muscle strength and interpretation of results. Postural measurements allow linkage of specific postural errors to the maximum strength of inspiratory and expiratory muscles. The asymmetrical location of the scapulae may be followed by a disturbance in the maximum strength of the inspiratory muscles.
Key point’s summary: Changes in maximum inspiratory muscle strength may change as a result of postural asymmetries.
Female soccer players have greater static respiratory muscle strength than non-athletes.
These results help us understand the relationship between postural anomalies and respiratory function.
Keywords: Maximal inspiratory pressure; Maximal expiratory pressure; Body posture; Optical measurements.
Citation: Paśko S, Sutkowski M, Grudniewski T, Żuk B. The relationship of postural asymmetry to inspiratory and expiratory pressure of young women. J Clin Images Med Case Rep. 2024; 5(10): 3313.
Introduction
The breathing sequence consists of two phases in which the superficial and deep muscles of the neck, chest, and abdomen are engaged by controlling two integrated mechanical pumps - pressing (heart) and suction (chest) - to fill the lungs with atmospheric air. During inhalation, the contraction of the primary respiratory muscles (diaphragm and external intercostals) increases the negative pressure in the chest by lowering the diaphragm cupola. With difficult and intensified inhalation, these muscles are supported by the accessory respiratory muscles [1,2].
The role of the diaphragm is not limited to breathing, and it participates in the activity of the abdominal organs, and affects the cervical and thoracic segments of the spine and the underbelly due to functional and structural interrelations [3].
The global assessment of respiratory muscles static fitness was invented by Black and Hyatt, who determined reference values for healthy people of different sexes and ages [4]. Other studies observed differences in the range of MIP and MEP values according to age, sex, and race of the analyzed population [5-9]. Observations revealed that, for healthy and physically fit people, MEP parameters are generally higher than MIP, and lower maximum pressure ranges are sufficient for normal respiratory function [10]. In pathological conditions with increased respiratory resistance, those ranges may be insufficient for proper lung ventilation. MIP and MEP values are lower in patients with severe Chronic Obstructive Pulmonary Disease (COPD) compared to healthy subjects, and the maximum inspiratory pressure decreases in people with mild and moderate functional disorders [11]. According to the reports, MIP is a good indicator for assessing the degree of respiratory muscle disorders in various diseases [12-15]. Ghanbari et al. analyzed improvement of MIP value as a result of the breathing muscle training. They found that the type and duration of exercise had an impact on athletic performance, strength, and endurance of respiratory muscles [16]. There are few reports regarding the assessment of muscle strength in athletes [17-20], as well as the effects on respiratory muscles in healthy individuals with postural errors [21,22].
The goal of the study was to assess the relationship between the Maximum Inspiratory Pressure (MIP) and Expiratory Pressure (MEP) and body posture in female soccer players. This research is a continuation of the studies regarding the physical health of young female soccer players [23].
Material and methods
The research was carried out in February 2017 in Biała Podlaska, Poland. The bioethics committee at the Warsaw Medical University approved the study under No. KB/49/2017. Each participant was notified about the purpose, voluntary nature, and non-invasiveness of the measurements, and was asked to give their written informed consent for participation (signed personally or by parents/legal guardians in the case of participants under 18). Additionally, a questionnaire consisting of several questions necessary for analysis was completed. All methods were carried out in accordance with relevant guidelines and regulations.
Participants
A group of 57 women aged 16-20 years was examined. Forty-two were playing soccer in the club AZS PSW Biała Podlaska. Club is classified in the Ekstraliga Kobiet - Polish female Premier League with 278 players in the 2016/2017 season. The remaining 15 volunteers were a control group without any pathological anomalies in the motor, respiratory, and circulatory systems. The group of soccer players was dominated by girls with primary education (78%) living in cities (10-100 thousand inhabitants), and the control group 60% had received secondary education and 53% lived in the countryside. Half of the soccer players had 6 or more years or playing experience, 45% had 3-5 years, and 5% had less than 2 years of experience. Training lasted less than 2 hours for 98% of players, with a frequency of 5-7 times a week (54.8%) to 1-2 times a week (7.2%). Participants engaged in occasional swimming, individual strength training, and cycling. In the control group, the subjects rarely swam or participated in a strength training or organized exercises, but had a higher frequency of cycling activity.
Measurements
MIP and MEP were measured with a non-invasive, handheld Micro Respiratory Muscle Analyzer (CareFusion). The device is widely used for reliability tests in both the sitting and standing positions, and meets the standards of the American Thoracic and European Respiratory Societies [10]. Participants were instructed on how to insert the mouthpiece, and how to perform the necessary maneuvers. During the measurements, the participants were verbally encouraged to exert maximum effort. MIP was measured three times at an innermost inhalation (TCL - Total Lung Capacity), and at 1-2 minute intervals. MEP was measured after a deep exhalation (RV - Residual Volume), and three times at the same intervals as MIP.
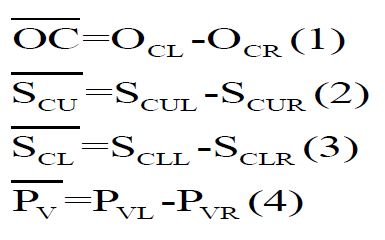
The body posture of the subjects was assessed from the dorsal coronal plane using a non-contact 3D photogrammetry system according to previously published methods [23,24]. Each participant stood inside the calibrated area with their back turned to the cameras, in a relaxed position with legs upright and slightly spaced feet, arms along the torso, and with their eyes facing forward. All participants wore underwear and a silicone head cap. Circular markers with a diameter ø10 mm were applied to the selected bone landmarks. To analyze postural asymmetry of the subjects, the following anatomical landmarks were selected: OCL, OCR - the bilateral outermost points of the inferior nuchal line of the skull; SCUL, SCUR - the position of the trigonum spina scapulae, bilaterally; SCLL, SCLR - the position of the inferior scapular angles, bilaterally; and PVL, PVR - the bilateral rear upper iliac spines. A group of vectors was determined for analysis (Figure 1):
Three body positions were analyzed: Resting (habitual, Hab 1), Upright (actively corrected, ActCor), and resting post-MIP/MEP measurement (Hab 2).
Statistical analysis
For statistical analysis, the R package version 3.6.2 was used. Normality of data distribution was verified by “shapiro.test” function, which performs the Shapiro-Wilk test. The dNon-normally distributed data were analyzed using “wilcox.test”, the two-sided non-parametric Mann-Whitney-Wilcoxon on the significance level on 0.05Mann-Whitney U or Wilcoxon tests. MIP and MEP values are reported as means. All the functions were a part of the “stats” package in version 3.6.2. A p-value less than 0.05 was determined to be statistically significant.
Results
Body mass and BMI were not associated with higher MIP and MEP measurements (Table 1). A statistically significant difference was observed in the maximum static expiratory pressure values (p = 0.002) (Figures 2 and 3). Results of MIP and MEP values were compared with other researchers in (Table 2).
Positive values in postural measurements indicate a lowering of one of the bone points on the right in relation to a corresponding point on the left side of the body. Asymmetry was evident in all three measured postural positions (Table 3).
The control group had greater asymmetry at the skull nuchal line in all analyzed body postures. The relative position of OCL vs. OCR points changed after measuring MIP and MEP in all participants. However, changes in maximal respiratory pressure were not dependent on the vector location. A tendency for MIP dependence on the angle of the cervical vertebrae extreme points was observed in the soccer players in the upright position after the measurement was taken. The distribution of MIP/MEP values were: Hab 1 (MIP: r=0.22, p=0.148; MEP: r=0.08, p = 0.601);
ActCor (MIP: r=0.44, p=0.003; MEP: r=0.16, p=0.293);
Hab 2 (MIP: r=0.38, p=0.012; MEP: r=0.06, p=0.707).
A relationship between the asymmetric arrangement of the scapulae (vectors SCU and SCL) and changes in MIP and MEP values was not observed. Although there were players with lower OCL values than the controls, the increase in S
Despite the threefold decrease in PVR vs. PVL in the soccer players compared to controls, this difference was not associated with statistically significant changes in MIP and MEP.
The mean MIP value was -73.82±21.71 for soccer players and -61.81±25.0 in the control group, and MEP values were 94.82±24.68 and 76.76±23.64, respectively. The difference between mean MIP and MEP values between the two groups was 16% and 19%, respectively. Soccer players presented a higher static strength of the respiratory muscles (r=0.48, p=0.001) compared to the control group (r=0.63, p=0.013).
A statistically significant difference (p=0.008) was observed in MIP values related to the spatial position of the scapular triangles in the group of soccer players. In positions Hab 1 and Hab 2, the MIP was inversely proportional to the asymmetry of the scapulae (r=-0.40), and the correlation decreased to r=-0.31 in the ActCor measurement. No correlation was established between MEP and scapular location. Respiratory muscle staticstrength did not change in relation to postural asymmetries.
Table 1: Anthropometric characteristics and mean of MIP and MEP of the examined groups, two-sided non-parametric Mann-Whitney-Wilcoxon test, p<0.05.
| Soccer players (n=42) | Control group (n=15) | p-value | |
|---|---|---|---|
| Body mass (kg) | 58,3±6,7 | 55,5±7,5 | 0,012 |
| BMI (kg/m²) | 21,0±2,3 | 20,2±2,6 | 0.006 |
| MIP (cm H₂O) | -81,53±21.88 | -77,86±19,69 | 0,099 |
| MEP (cm H₂O) | 103,81±25,33 | 88,86±22,93 | 0,002 |
Table 2: Results of MIP and MEP measurements obtained in the test in relation to literature.
| Soccer players (n=42) | Control group (n=15) | Leech et al. 13-35 age | Ringqvist 18-29 age | Cook et al. 18-32 age | |
|---|---|---|---|---|---|
| MIP (cm H₂O) | -81,53±21.88 | -72,86±19,69 | -85±28 | -113±24 | -100±19 |
| MEP (cm H₂O) | 103,81±25,33 | 88,86±22,93 | 95±29 | 170±29 | 146±34 |