
Journal of Clinical Images and Medical Case Reports
ISSN 2766-7820
Research Article - Open Access, Volume 6
Quantitative brain echogenicity in newborns and infants and its association with later neurodevelopmental outcome and white matter appearance: A systematic review
Gianluigi Laccetta*; Maria Di Chiara; Maria Chiara De Nardo; Raffaella Cellitti; Alberto Spalice; Gianluca Terrin
Department of Maternal Infantile and Urological Sciences, Sapienza University of Rome, Viale del Policlinico 155, 00161 Rome, Italy.
*Corresponding Author : Gianluigi Laccetta
Department of Maternal Infantile and Urological
Sciences, Sapienza University of Rome, Viale del
Policlinico 155, 00161 Rome, Italy.
Tel: +39 06 4997 2536;
Email: gianluigi.laccetta@uniroma1.it
Received : Nov 27, 2024
Accepted : Jan 23, 2025
Published : Jan 30, 2025
Archived : www.jcimcr.org
Copyright : © Laccetta G (2025).
Abstract
CUS is widely used to monitor brain damage in newborns admitted to the NICU; however, it is limited by inter-observer variability in the interpretation of images. We performed a systematic review in accordance with the PRISMA statements in order to assess whether quantitative analysis of brain echogenicity could predict later neurodevelopment (a) and WM appearance in newborns (b). Eligible articles in English language were searched in MEDLINE, Scopus, and ISI Web of Science databases; the following MeSH terms were used: “brain”, and “ultrasonography”. Unpublished data were searched in ClinicalTrials. gov website. All studies published until January 30th, 2023 and including patients which underwent one or more quantitative evaluations of brain echogenicity were included. Subgroup analysis was conducted for each one of the two outcomes. The quality assessment was performed using the appropriate NIH Quality Assessment Tools. Eight articles were included. PBI is the most promising technique for early prediction of neurodevelopment, with FP WM/BN and PO WM/BN ratios being the 2 parameters which better correlate with neuromotor status at term. TA is the technique of choice for early prediction of WM appearance, with ASM, contrast, and entropy being the parameters which better allow to distinguish between patients without WM damage and those who will develop cystic PVL. The quality is poor for most of the included studies. Both PBI and TA appear promising techniques for early prediction of neurodevelopment and WM appearance. However, further studies of good quality are needed to better define the potential of these approaches.
Keywords: Brain ultrasonography; Cranial ultrasound; Quantitative echogenicity; Pixel brightness intensity; Texture analysis; Region of interest; Neurodevelopment; White matter; Periventricular leukomalacia; Preterm newborn.
Citation: Laccetta G, Di Chiara M, De Nardo MC, Cellitti R, Spalice A, et al. Quantitative brain echogenicity in newborns and infants and its association with later neurodevelopmental outcome and white matter appearance: A systematic review. J Clin Images Med Case Rep. 2025; 6(1): 3447.
Introduction
It has been estimated that about one third of the newborns admitted to the Neonatal Intensive Care Unit (NICU) are at significant high risk of brain damage [1]. Periventricular Leukomalacia (PVL) is the most commonly diagnosed cerebral injury in preterm-born infants, with its non-cystic variety being the prevalent form among these patients [2-9]. Preterm White Matter (WM) damage is related to both maturational and predisposing factors such as birth asphyxia, hypotension, intrauterine and postnatal infections, and necrotizing enterocolitis [3]. In the case of term infants, brain injury usually consists of hypoxic ischemic lesions due to perinatal asphyxia and located in the subcortical and deep WM, basal ganglia, and thalamus [10,11]. Early diagnosis of cerebral damage is essential for implementation of appropriate and timely interventions aimed at reducing the odds of subsequent neurodevelopmental impairment [12]. Thus, all at-risk newborns need to be accurately monitored by means of neuroimaging techniques, which represent the standard diagnostic tool for cerebral injury [2-12]. Serial examinations of neonatal brain are needed to reduce diagnostic delay and errors and to investigate the progression of injury over time, as it happens for periventricular hyperechogenicities evolving into the cystic form of leukomalacia [13,14]. Furthermore, given that cerebral injuries sometimes need to be investigated when the baby is clinically unstable, the tool for assessment of cerebral damage should be suitable for usage even at the patient’s bedside [10-14]. Magnetic Resonance Imaging (MRI) is the gold standard for the assessment of cerebral damage in newborns but safety concerns related to transport and physiological disturbances (e.g., temperature change) in critically ill patients potential need for sedation, and high cost limit its use [2]. At the same time, the advantages of cranial ultrasonography (CUS) (e.g., portability, non-invasiveness, cost-effectiveness, absence of ionizing radiations) make this technique readily available at most institutions to characterize brain damage [2]. However, the main limits of ultrasonography are the inter-observer variability in the interpretation of images and the need of objective parameters to increase its diagnostic accuracy [15]. In this regard, some studies have demonstrated that quantitative analysis of brain echogenicity could provide solution to the problem of subjective interpretation of CUS, and improve early detection of neonatal brain damage and assessment of its severity [16-18]. Quantitative analysis of brain echogenicity is usually performed within selected Regions of Interest (ROIs) by means of different techniques, ranging from the assessment of Pixel Brightness Intensity (PBI), Integrated Backscatter (IBS) or the Intensity of Radio-Frequency (IRF) signals, to Texture Analysis (TA) [16-20]. PBI is an objective measure of echogenicity, or ability of a portion of tissue to bounce an echo18. It estimates the brightness of a single pixel, intended as the smallest component of a digital image, or the mean brightness of pixels within a designated ROI [18]. IBS is a measure of total backscattered energy from a specific portion of interrogated tissue [19]. This technique requires images in which the gray level is displayed proportional to the integrated backscattered power; however, acquisition of these supplementary scans could prolong the time needed to complete the examination [19]. IRF is a measure of intensity of the radio-frequency signal, which is the fundamental signal from which B-mode images are made [20]. However, this technique requires that radio-frequency signal is not processed so that the analysis of its intensity curve (shape, pattern, maximal and minimal intensities and their frequencies) allows a better characterization of tissues [20]. TA measures differences in the grayscales representing a selected ROI and expresses them through a wide number of complex radiomic parameters, thus enhancing characterization of each portion of the analysed tissue [21]. All the aforementioned techniques have been used in the experimental context, and consensus about their role in the clinical setting is still far to be reached [20,22-24]. This systematic review is designed to clearly assess whether quantitative analysis of brain echogenicity by means of the previously mentioned techniques could be useful in the clinical context, particularly in early prediction of a) cystic/non-cystic PVL or absence of WM damage, and b) neurodevelopmental outcome in both preterm and full-term newborns.
Methods
We performed a systematic review of current available literature in accordance with the Preferred Reporting Items for Systematic Reviews and Meta-Analyses (PRISMA) statements (Table 1) [25,26].
Search strategy: A standard systematic search strategy was adopted27. First of all, we conducted electronic searches in MEDLINE, Scopus, and ISI Web of Science databases; thus, manual search of the reference lists of all eligible articles was performed. Finally, electronic and manual screening of conference abstracts and documents from relevant organizations (The Society for Pediatric Radiology, European Society for Paediatric and Neonatal Intensive Care, World Health Organization), and search of unpublished data in ClinicalTrials.gov website were also performed. The following medical subject headings and terms (MESH) were used for doing electronic searches: “brain” and “ultrasonography”; the terms “quantitative brain ultrasound”, “quantitative head ultrasound”, “quantitative cranial ultrasound”, “quantitative brain ultrasonography”, “quantitative cranial ultrasonography”, “brain ultrasound”, “cerebral ultrasound”, “head ultrasound”, “cranial ultrasound”, “cerebral ultrasonography”, “head ultrasonography”, and “cranial ultrasonography” were also used. The full search strategies for all databases and websites, including any filters and limits used, are described in Table 2, in accordance with the PRISMA statements [25].
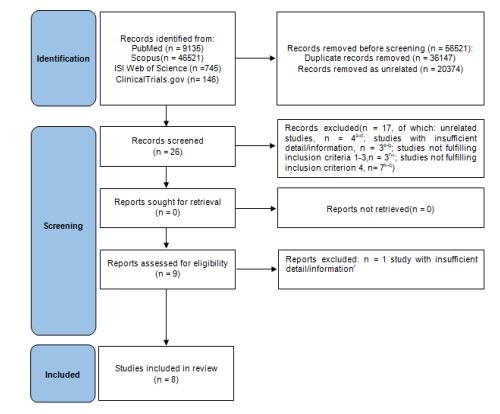
Study selection: We considered eligible any study fulfilling all the following criteria: 1. Studies of any design published in English language before January 30th, 2023; [2]. Studies in which preterm and/or term newborns and infants underwent one or more quantitative assessment of the echogenicity of at least one brain region from birth to 12 months of age; 3. Studies in which the results of quantitative assessment(s) of the echogenicity of brain regions are numerically expressed; 4. Studies in which quantitative results of brain echogenicity have been related to (a) subsequent neurodevelopmental outcome and/ or (b) later occurrence of cystic/non-cystic PVL or absence of WM damage (in this case, CUS and quantitative analysis of brain echogenicity had to be performed within 14 days of postnatal age). All the authors independently assessed eligibility of related studies for the inclusion according to the previously mentioned criteria; publications with insufficient detail/information and duplicate studies were excluded. In case of different opinions among authors, consensus was achieved after discussion. A designated form was used to check if studies fulfilled inclusion criteria and to extract necessary information from the selected articles. The study selection form is represented in Table 3. All the authors independently extracted data from the selected investigations. The process of literature search and assessment of study eligibility for inclusion is represented in Figure 1 [26].
Table 1: PRISMA 2020 checklist for our systematic review [26].
| Section andtopic | Item # | Checklist item | Yes/No/Other* |
|---|---|---|---|
| TITLE | |||
| Title | 1 | Identify the report as a systematic review. | Yes |
| ABSTRACT | |||
| Abstract | 2 | See thePRISMA 2020 for abstracts checklist. | Yes |
| INTRODUCTION | |||
| Rationale | 3 | Describe the rationale for the reviewin the context of existing knowledge. | Yes |
| Objectives | 4 | Provide an explicit statement of the objective(s) or question(s) thereview addresses. | Yes |
| METHODS | |||
| Eligibility criteria | 5 | Specify the inclusion andexclusion criteria for the reviewand how studieswere grouped for the syntheses. | Yes |
| Information sources | 6 | Specify all databases, registers, websites, organisations, reference lists andother sources searched or consulted toidentify studies. Specify the date when each source was last searched orconsulted. | Yes |
| Search strategy | 7 | Present the fullsearch strategies for all databases, registers and websites, including any filters and limitsused. | Yes |
| Selection process | 8 | Specify the methods usedto decide whether a study metthe inclusion criteria of the review, including how manyreviewers screened each record and each reportretrieved, whether theyworked independently, and ifapplicable, details of automation tools used in the process. | Yes |
| Data collectionprocess | 9 | Specify the methods used to collect data from reports, including how manyreviewers collected datafrom each report, whetherthey worked independently, any processes for obtaining or confirming datafrom study investigators, and ifapplicable, details of automation tools used in the process. | Yes |
| Data items | 10a | Listand define all outcomes for which data were sought. Specify whether all results thatwere compatible with each outcomedomain in each study weresought (e.g., forall measures, timepoints, analyses), and if not, the methods used to decide whichresults to collect. | Yes |
| 10b | Listand define allother variables forwhich data weresought (e.g., participant and intervention characteristics, funding sources). Describe any assumptions madeabout any missingor unclear information. | Yes | |
| Study risk of biasassessment | 11 | Specify the methodsused to assessrisk of biasin the included studies, including detailsof the tool(s)used, how many reviewersassessed each study and whether they worked independently, and if applicable, details of automation tools used in theprocess. | Yes |
| Effect measures | 12 | Specify for eachoutcome the effectmeasure(s) (e.g., riskratio, mean difference) used in the synthesis or presentationof results. | Yes |
| Synthesis methods | 13a | Describe the processes used to decide which studies wereeligible for each synthesis (e.g., tabulating the study intervention characteristics and comparing againstthe planned groupsfor each synthesis (item #5)). | Yes |
| 13b | Describe any methods required to preparethe data for presentation or synthesis, suchas handling of missingsummary statistics, or data conversions. | Not applicable | |
| 13c | Describe any methods usedto tabulate or visually display results of individual studies and syntheses. | Yes | |
| 13d | Describe any methods used to synthesize results and providea rationale forthe choice(s). If meta-analysis was performed, describe the model(s),method(s) to identify the presence and extent of statistical heterogeneity, and software package(s)used. | Yes | |
| 13e | Describe any methodsused to explore possible causes of heterogeneity amongstudy results (e.g.,subgroup analysis, meta-regression). | Yes | |
| 13f | Describe anysensitivity analyses conducted to assess robustness of the synthesized results. | Not applicable | |
| Reporting biasassessment | 14 | Describe any methods used to assessrisk of bias due to missing results in a synthesis (arising from reporting biases). | Yes |
| Certainty assessment | 15 | Describe any methods used to assesscertainty (or confidence) in the bodyof evidence for an outcome. | Yes |
| RESULTS | |||
| Study selection | 16a | Describe the results of the searchand selection process, from the numberof records identified in the search to the number of studies includedin the review, ideally using a flow diagram. | Yes |
| 16b | Cite studies thatmight appear to meet the inclusion criteria, but which wereexcluded, and explain why they wereexcluded. | Yes | |
| Study characteristics | 17 | Cite eachincluded study and present its characteristics. | Yes |
| Risk of bias in studies | 18 | Present assessments of risk of bias for each included study. | Yes |
| Results of individual studies | 19 | For all outcomes, present, for eachstudy: (a) summary statistics for eachgroup (where appropriate) and(b)an effect estimate and its precision (e.g., confidence/credible interval), ideally using structured tablesor plots. | Yes |
| Results of syntheses | 20a | For eachsynthesis, briefly summarise the characteristics and risk of bias amongcontributing studies. | Yes |
| 20b | Present results of all statistical syntheses conducted. If meta-analysis was done, present for each the summaryestimate and its precision (e.g., confidence/credible interval) and measuresof statistical heterogeneity. Ifcomparing groups, describe the direction of the effect. | Yes | |
| 20c | Present results of all investigations of possible causesof heterogeneity amongstudy results. | Yes | |
| 20d | Present results of all sensitivity analyses conducted to assess the robustness of the synthesized results. | Not applicable | |
| Reporting biases | 21 | Present assessments of risk of bias due to missingresults (arising from reporting biases) for each synthesisassessed. | Yes |
| Section andtopic | Item # | Checklist item | Yes/No/Other* |
| Certainty of evidence | 22 | Present assessments of certainty (or confidence) in the body of evidence for each outcome assessed. | Yes |
| DISCUSSION | |||
| Discussion | 23a | Provide a general interpretation of the resultsin the context of other evidence. | Yes |
| 23b | Discuss anylimitations of the evidence included in the review. | Yes | |
| 23c | Discuss any limitations of the reviewprocesses used. | Yes | |
| 23d | Discuss implications of the results for practice, policy, and future research. | Yes | |
| OTHER INFORMATION | |||
| Registration andprotocol | 24a | Provide registration information for the review,including register name and registration number, or statethat the review was not registered. | Not registered |
| 24b | Indicate wherethe review protocol can be accessed, or state thata protocol was not prepared. | Not prepared | |
| 24c | Describe and explain anyamendments to information provided at registration or in the protocol. | Not applicable | |
| Support | 25 | Describe sources of financial or non-financial support for the review, and the roleof the fundersorsponsors in the review. | Yes |
| Competing interests | 26 | Declare any competing interests of review authors. | Yes |
| Availability of data, code and other materials | 27 | Report which of the following are publicly available and where they can be found: template data collection forms; data extracted from includedstudies; data used for all analyses; analytic code; any other materials used in the review. | Yes |
Adapted from: Page MJ, McKenzie JE, Bossuyt PM, Boutron I, Hoffmann TC, Mulrow CD, Shamseer L, Tetzlaff JM, Akl EA, Brennan SE, Chou
R, Glanville J, Grimshaw JM, Hróbjartsson A, Lalu MM, Li T, Loder EW, Mayo-Wilson E, McDonald S, McGuinness LA, Stewart LA, Thomas J, Tricco
AC, Welch VA, Whiting P, Moher D. The PRISMA 2020 statement: an updated guideline for reporting systematic reviews. BMJ 2021;372:n71. doi:
10.1136/bmj.n7126. For more information, visit: http://www.prisma-statement.org/
*Other: not applicable, not registered, not prepared
Table 2: Full search strategies for all databases and websites consulted during the selection process of the included studies.
| Medline (https://www.nlm.nih.gov/) |
|---|
| ("Brain"[Mesh]) AND"Ultrasonography"[Mesh] |
| Scopus (https://www.scopus.com/) |
| (ALL (quantitative) AND ALL (brain)AND ALL (ultrasound)) |
| ISI Web of Science (https://www.webofscience.com/) |
| quantitative (Allfields) and brain(All fields) andultrasound (All fields) |
| ClinicalTrials.gov (https://clinicaltrials.gov/) |
| Other terms:“Quantitative brain ultrasound” (all studies) – also searched for “Cerebral” |
| Other terms:“Quantitative head ultrasound” (all studies) – also searched for “Ultrasonography” |
| Other terms:“Quantitative cranial ultrasound” (all studies) |
| Other terms:“Quantitative brain ultrasonography” (all studies) – also searched for “Ultrasound” and “Cerebral” |
| Other terms:“Quantitative cranial ultrasonography” (all studies) |
| The Society for Pediatric Radiology (https://www.spr.org/) |
| Search: “BrainUltrasound” |
| Search: “Cerebral Ultrasound” |
| Search: “HeadUltrasound” |
| Search: “Cranial Ultrasound” |
| Search: “BrainUltrasonography” |
| Search: “Cerebral Ultrasonography” |
| Search: “HeadUltrasonography” |
| Search: “Cranial Ultrasonography” |
| European Society for Paediatric and Neonatal Intensive Care (https://www.espnic.eu) |
| Search: “BrainUltrasound” |
| Search: “Cerebral Ultrasound” |
| Search: “HeadUltrasound” |
| Search: “Cranial Ultrasound” |
| Search: “BrainUltrasonography” |
| Search: “Cerebral Ultrasonography” |
| Search: “HeadUltrasonography” |
| Search: “Cranial Ultrasonography” |
| World Health Organization (https://www.who.int/) |
| Search: “BrainUltrasound” |
| Search: “Cerebral Ultrasound” |
| Search: “HeadUltrasound” |
| Search: “Cranial Ultrasound” |
| Search: “BrainUltrasonography” |
| Search: “Cerebral Ultrasonography” |
| Search: “HeadUltrasonography” |
| Search: “Cranial Ultrasonography” |
| Author(s) | Publication year | Country | Inclusion criteria§ | Type of study° | Population* | Differences atbaseline@ | Exclusion criteria | US machine | Machinesettings# |
|---|---|---|---|---|---|---|---|---|---|
§1. Studies of any design published in English language before January 30th, 2023; 2. Studies in which preterm and/or term newborns and infants
underwent one or more quantitative assessment of the echogenicity of at least one brain region from birth to 12 months of age; 3. Studies in
which the results of quantitative assessment(s) of the echogenicity of brain regions are numerically expressed; 4. Studies in which quantitative
results of brain echogenicity have been related to (a) subsequent neurodevelopmental outcome and/or (b) later occurrence of cystic/non-cystic
PVL or absence of WM damage (in this case, CUS and quantitative analysis of brain echogenicity had to be performed within 14 days of postnatal
age). All 4 criteria must be met contemporarily in order to allow inclusion of the paper.
°Prospective cohort study (P), retrospective cohort study (R), cross-sectional study (CS), case-control study (CC)
*For each study group: number of patients (N), gestational age at birth (GA), birth weight (BW), characteristics
@Statistically significant differences among the study groups at baseline
#Operator-dependent or fixed machine settings (specify)
Table 3: Study selection forms.
| Author(s) | Publicationyear | Timing ofCUS | ROI^ | Software for ROIanalysis | Result(s)ⴕ | Interpretation ofresults | Risk of biasα | Note(s) | Reference |
|---|---|---|---|---|---|---|---|---|---|
^Plane (Pl), region (Re), shape (S), area (A)
ⴕAbsolute value of echogenicity of a brain region (mean, mean±SD, range, cut-off), ratio between the echogenicity values of two brain regions
(mean, mean±SD, range, cut-off), difference between the echogenicity values of two brain regions (mean, mean±SD, range, cut-off)
αGood, Fair, Poor
Table 4: Characteristics of the studies included in our systematic review: design, population and exclusion criteria.
| Author(s) YearCountry Technique | Study designoutcome(s) | Population | Exclusion criteria | |||||
|---|---|---|---|---|---|---|---|---|
| Group number | N | GA | BW | Characteristics | Significant differencesat baselinez | |||
| Simaeys et al. 2000 Belgium PBI22 | Cross-sectional study B | 1 | 11 | NA | NA | Uncomplicated obstetrichistory and normal US scans | Not reported | NA |
| 2 | 9 | NA | NA | Complicated obstetric his- tory and earlynon-cystic diffuse PVL at US scans | ||||
| Pinto et al.2012 United StatesPBI28 | Retrospectivecohort studyA | 1 | 31 | 360/7-420/7a | NA | GA ≥ 36 weeks + HIEy who hadbeen selected for cooling treatment | Not reported | Poor imagequality |
| 2 | 11 | NA | NA | GA ≥ 36 weeks +normal brain US studies and nor- mal initial and follow-up neurological examinations | ||||
| Beller et al. 2015 Israel PBI18 | Prospectivecohort studyA | 1 | 58 | 30.6±2.3 | 1211.2± 224.7 | <34 weeks’GA, normal neonatal brainUS or mild-to-moderate diffuse PVE, absence of major cerebral pathologies and routine predischarge neuromotor evaluation after 35 weeks’ PMA | Not required | Genetic syndromes, cerebral infections, congenital brainabnormalities, acquired brainabnormalities &, poor image quality |
| Fujimoto et al. 2003Japan IBS23 | Prospectivecohort study A+B | 1 | 13 | 22-31b,c | 570- 996n | ELBW, normalcranial MRI beforehospital discharge, no neurodevelopmental abnormalities up to 6-12 months | Not reported | Congenital brainabnormalities, acquired brainabnormalities |
| 2 | 14 | 27-36c,d | 1038- 1496o | VLBW, normalcranial MRIbefore hospital discharge, no neurodevelopmental abnormalities up to 6-12 months | ||||
| 3 | 14 | 29-37c,e | 1538- 2358p | LBW, normalcranial CT before hospital discharge, no neurodevelopmental abnormalities up to 6-12 months | ||||
| 4 | 19 | 37-40c,f | 2580- 3690q | GA ≥ 37 weeks andnormal BW | ||||
| Hope et al. 2004 Canada TA24 | Case-control study A | 1 | 12 | NA | NA | GA < 31 weeks, absence of PVL at brain US and normalfinal outcome | Not reported | NA |
| 2 | 6 | NA | NA | GA < 31 weeks, absence of PVL at brain US and cerebralpalsy as final outcome | NA | |||
| Tenorio et al.2011 SpainTA16 | Prospective cohort studyB | 1 | 30 | 260/7-315/7g,h,* | 600- 1700r,s | Normalfindings or PV echo densities at the firstbrain US scan(0-7 days of life)and normal brain US scan at 14-31days of life | No | Metabolic disorders, geneticsyndromes, congenital cardiac abnormalities, monochorionic twins |
| 2 | 14 | 262/7-316/7h,i,* | 460- 1900s,t | Normalfindings or PV echo densities at the firstbrain US scan (0-7 days of life)and PVL grade1 at the second brainUS scan (14-31 days of life) | ||||
| Narchi et al. 2013 United KingdomTA17 | Case-controlstudy B | 1 | 10 | 27-30j,k | 750-1420u,v | PVE at the initial brain US scan (first week of life), which later resolved; developmental delay n=0, cerebral palsy n=0* | The age whenthe last scan was performed was significantly olderin patients with confirmedcystic PVL | Congenital brain abnormalities, acquired brain abnormalities&, acutehypoxic episodes, metabolic disorders, congenital infections, cerebral infections |
| 2 | 10 | 25-32k,l | 500-1660v,w | PVE at the initial brain US scan (first week of life), which later evolved into cysticPVL; developmental delay n=3, cerebral palsy n=4* | ||||
| You et al.2015 South KoreaTA29 | Case-controlstudy B | 1 | 20 | 27.4±1.9m,* | 892.5± 216.3x | <37 weeks’ GA at birth,no WM injury at brain MRI | The incidence of BPD was higher in patients with normal MRI (18/20, 90%) than patients withmoderate to severe WM injury (4/8, 50%) or mildWM injury (2/5, 40%). The interval between birth and brain MRI in patients with moderate to severe WM injury was shorter thanin the othergroups | Congenital brain abnormalities, acquired brain abnormalities&, cerebral infections |
| 2 | 5 | 30.6±3.2m,* | 1388.0± 521.0x | <37weeks’ GA at birth, mild WM injuryat brain MRI | ||||
| 3 | 8 | 29.7±3.2m | 1199.6± 642.3x | <37 weeks’ GA at birth, moderate to severe WM injuryat brain MRI | ||||
A, relationship between quantitative brain echogenicity within 12 months of age and later neurodevelopmental outcome in both preterm and
term infants; B, relationship between quantitative echogenicity of WM within 14 days of postnatal age and later occurrence of cystic/non-cystic
PVL or absence of WM damage; BW, birth weight [mean ± SD (grams) or range (grams)]; CT, computed tomography; ELBW, extremely low birth
weight; GA, gestational age [mean ± SD (weeks) or range (weeks)]; HIE, hypoxic-ischemic encephalopathy; LBW, low birth weight; MRI, magnetic
resonance imaging; N, number of patients; NA, not available; PMA, postmenstrual age; PV, periventricular; PVE, periventricular echogenicity;
PVL, periventricular leukomalacia; US, ultrasound; VLBW, very low birth weight; WM, white matter.
*Statistically significant difference
amean 392/7 weeks; bmean 28±2 weeks; cGA≤27 weeks: 9 patients, 28-32 weeks: 15 patients, 33-36 weeks: 12 patients, 37-41 weeks: 24 patients; dmean 32±3 weeks; emean 35±3 weeks; fmean 39±1 weeks; gmedian 294/7 weeks; hmedian 293/7 weeks, range 260/7-316/7 weeks;
imedian 280/7 weeks; jmean 28.6 weeks; kmean 28.5±1.9 weeks; lmean 28.5 weeks; mmean 28.45±2.7 weeks; nmean 795±172 g; omean
1279±155 g; pmean 1884±283 g; qmean 3031±352 g; rmedian 1210 g; smedian 1200 g, range 460-1900 g; tmedian 1000 g; umean 1123 g; vmean
1183±354 g; wmean 1243 g; xmean 1042±436.8 g; yclinical evidence of encephalopathy and ≥ 2 of the following: 1) Apgar score ≤ 5 at 10 minutes, 2) Need of mechanical ventilation at 10 minutes, 3) Umbilical cord pH < 7.00; zfurther statistically significant differences among the study
groups at baseline; &intracranial haemorrhages (intraventricular haemorrhage, cerebellar haemorrhage), hydrocephalus, cerebral infarction,
porencephaly, and traumatic lesions are included.
Table 5: Details about acquisition of ultrasonographic images for subsequent quantitative analysis of the echogenicity of brain regions.
| Author(s) YearCountry Technique | Outcome(s) | US machine | Machine settings | Software forROI analysis | ROI | ||
|---|---|---|---|---|---|---|---|
| Plane | Area | Shape | |||||
| Simaeys et al. 2000 Belgium PBI22 | B | Ultramark 4A scanner(ATL) | F | NA | Cof | NA | Rectangular |
| Pintoet al. 2012United States PBI28 | A | ZonareUS equipment (Zonare, Medical Systems, Mountain View,CA, USA) | Oda | NA | PSa | NA | Ovaln,Coincident with anatomical borderso |
| Beller et al.2015 Israel PBI18 | A | General Electric Vivid-I | Od | ImageJ Java | Cog | C | Circular |
| Fujimoto et al. 2003 Japan IBS23 | A+B | SONOS 5500 (Philips Medical System, Andover, MA, USA) | Fb | NA | PSa | Ck | Oval |
| Hope et al.2004 Canada TA24 | A | Epson Perfection 3200 dpiscanner | Od | NA | Coh | NA | Rectangular |
| Tenorio et al. 2011 Spain TA16 | B | Sonoline Antares US equipment (Siemens Medical Solutions,Malvern, PA) | Odc | Automatic Quantitative Ultrasound Analysis version 1.0, 2010(Trans- mural Biotech SL) | Coi | NA | Coincident with anatomical bordersp |
| Narchiet al. 2013United Kingdom TA17 | B | Philips HD 11scanner (GE Healthcare, Buckinghamshire, UK) | Odd | MaZda-B11 softwareversion 4.5 | Co, Sa, PSa | Vl | Squared |
| You et al. 2015 South Korea TA29 | B | Vivid 7 system(GE Vingmed, Horten,Norway) | Ode | ImageJ Javaversion1.44; Medical Imaging Solution for Segmenta- tion and Texture Analysis software | Coj | Vm | Circularq |
A, relationship between quantitative brain echogenicity within 12 months of age and later neurodevelopmental outcome in both preterm and
term infants; B, relationship between quantitative echogenicity of white matter within 14 days of postnatal age and later occurrence of cystic/
non-cystic periventricular leukomalacia or absence of white matter damage; C, constant; Co, coronal; F, fixed; IBS, integrated backscatter; NA, not
available; Od, operator-dependent; PBI, pixel brightness intensity; PSa, parasagittal; Sa, sagittal; TA, texture analysis; V, variable.
aangle of transducer, depth, number of US foci, tissue gain and brightness; bfrequency 12 MHz, US gain; cfrequency 7.5 MHz, transducer posteriorly oriented at around 45°; however, gain and time-gain compensation were adjusted at discretion of the clinician performing US examination;
dtime-gain compensation, focal depth, compounding were adjusted each time; ethe operators were allowed to adjust the machine settings such
as depth, gain and time-gain compensation (routine settings for neonatal CUS: scan depth 8.0 cm, center frequency 8 MHz, power -3 dB, dynamic
range 66, gain -12, degree of frame averaging 10, frame rate 27.7); fcoronal through the glomus choroideum; gcoronal through the trigone of the
lateral ventricles for fronto-parietal periventricular white matter, choroid plexus and fronto-parietal bone; coronal through the parieto-occipital
lobes for parieto-occipital periventricular white matter and parietal bone; hsemi-coronal at level of the atria of the lateral ventricles; iposterior
coronal; jcoronal posterior to the ventricular antrum; k11x11 pixels; l≥ 2000 pixels; mmean pixel area 223.6 (range 187.8-259.4); novoid for white
matter of the cingulate gyrus; oadapted to the anatomy of the cortex for gray matter of the cingulate gyrus; pcoincident with the anatomical
borders of periventricular white matter and choroid plexuses; qapproximately spherical.
Table 6: Relationship between quantitative echogenicity of different brain regions and later neurodevelopment in newborns and infants. At present, no studies defining the relationship between quantitative brain echogenicity and later cognitive and language development have been published. Furthermore, IRF has never been used to assess the primary outcome.
| Author(s) YearCountry Technique | ROIs | Neurodevelopment | |||
|---|---|---|---|---|---|
| Motor | General | ||||
| Normal | Pathological | Normal | Pathological | ||
| Pintoet al., 2012United States PBI28a,b | WM/GrM | 1.234±0.159c | |||
| Beller et al.,2015 Israel PBI18d,e | FP WM/BN | 42.6±9.1f | |||
| PO WM/BN | 42.3±6.5g | ||||
| Fujimoto et al., 2003Japan IBS23h,i | Deep WM | ELBW: 24.6±4.3j, 18.2±3.6k; VLBW: 22.5±2.8j, 16.1±3.2k; LBW: 15.0±4.0j, 14.1±3.0k; NBW: 11.5±3.1j, 8.0±3.6k | |||
| Subcortical WM | ELBW: 19.2±6.3j, 15.6±3.9k; VLBW: 19.2±2.6j, 13.8±3.3k; LBW: 12.6±4.5j, 14.1±3.6k; NBW: 7.8±2.6j, 8.9±2.5k | ||||
| Choroid plexus | ELBW: 31.8±4.3j, 26.2±2.8k; VLBW: 28.5±4.0j, 25.6±3.5k; LBW: 22.5±4.2j, 22.3±4.5k; NBW: 18.8±2.8j, 20.9±4.1k | ||||
| Thalamus | ELBW: 21.4±4.0j, 17.4±1.9k; VLBW: 19.2±1.7j, 15.8±2.5k; LBW: 16.0±3.8j, 14.2±2.4k; NBW: 11.3±1.6j, 13.5±3.1k | ||||
| Lateral ventricle | ELBW: 11.3±5.3j, 5.3±2.3k; VLBW: 10.5±3.4j, 7.2±2.7k; LBW: 7.8±1.6j,5.7±2.1k; NBW: 5.6±1.6j, 4.2±1.8k | ||||
| Occipital bone | ELBW: 50.0±4.0j, 48.0±3.6k; VLBW: 47.4±3.5j, 46.5±3.1k; LBW: 43.7±5.2j, 44.0±3.2k; NBW: 38.9±5.1j, 36.5±6.8k | ||||
| Hope et al.,2004 Canada TA24l,m | WM/CP | DMM, NSAratio: 1.440-1.860n; Gabor T=3, NSAratio: 1.190-1.730n;Gabor T=7, STATratio: 2.190-3.350n; GM, NSA-ratio: 1.350-1.800n | DMM, NSAratio: 0.740-1.330n; Gabor T=3, NSAratio: 1.020-1.140n;Gabor T=7,STATratio: 0.780-1.370n; GM, NSAratio: 0.954-1.150n | ||
| WM- CP | DMM, NSAdiff: 1.580-3.100n; GaborT=7, NSAdiff: 351-1023n; GM, NSAdiff: 1.840-4.050n | DMM, NSAdiff: -0.450-0.650n; Gabor T=7, NSAdiff: -231-149n; GM, NSAdiff: -0.350- 0.990n | |||
ROIs were positioned in the WM/GrM of the cingulate gyrus (side not specified). All measurements were repeated twice and the value with
the smallest standard deviation was selected; bAll infants had normal initial and follow-up neurological examination; cCUS examination was
performed within the first 6 days of life (mean 2.63 days); dNo significant differences were detected between homologue (right and left)
ROIs, thus the mean PBI values of right and left hemispheres were averaged; eLAPI was administered prior to discharge after reaching the
35th week of gestation. RE values from the early (1st week) CUS studies were not associated with any of the LAPI neuromotor scores. In the
intermediate CUS studies, only the fronto-parietal REBN negatively correlated with the motor, neurological and developmental LAPI scores.
In the later predischarge CUS studies, only the parieto-occipital REBN negatively correlated with the motor and developmental predischarge
LAPI scores; fCUS examination between the 2nd and 5th week of life; gCUS examination beyond the 6th week of life; hThere was no difference
in the IBS value of each ROI between left and right cerebral hemispheres. The differences between each ROI among the 4 birth weight
groups were statistically significant at days 0 and 28, except for the lateral ventricle. A decrease of IBS values was seen at day 28 compared
to those at day 0 in ELBW and VLBW infants in all ROIs except for subcortical WM in VLBW infants and occipital BN; iNo children had obvious
neurodevelopmental abnormalities up to 6-12 months; jCUS examination performed at the day of birth (day 0); kCUS examination performed
at 28 days after birth (30 days after birth for NBW infants); lSamples of WM and CP were selected on coronal images at level of the atria of
lateral ventricles. After having calculated NSA and STAT values for both sides, ratios and differences of WM and CP were obtained and the
left and right halves were averaged [for example: NSAratio = ½ * (NSAWM left/NSACP left + NSAWM right/NSACP right)]. The means of the
texture measures differ based upon the patient outcome; mAmong 18 patients, 6 developed cerebral palsy; nTiming of CUS examination is
not specified.
Abbreviations: BN: Bone; CP: Choroid Plexus; CUS: Cranial Ultrasound; DMM: Non-Linear Technique for Processing Images based upon
Histogram Characteristics; ELBW: Extremely Low Birth Weight; FP: Fronto-parietal; GM: Grey-Level Morphology; GrM: Gray Matter; IBS:
Integrated Backscatter; IRF: Intensity of Radio-Frequency; LAPI: Lacey Assessment of the Preterm Infant; LBW: Low Birth Weight; NBW:
Normal Birth Weight; NSA: Normalized Surface Area; PBI: Pixel Brightness Intensity; PO: Parieto-Occipital; RE: Relative Echogenicity; REBN:
Echogenicity Value in Relation to Bone; ROI: Region of Interest; STAT: Standard Deviation of the Intensity; TA: Texture Analysis; VLBW: Very Low
Birth Weight; WM: White Matter.
Table 7: Quantitative echogenicity of PV WM within the 14th day of life and its relationship with late diagnosis of cystic/non-cystic PVL or absence of WM damage. At present, IRF has never been used to assess the secondary outcome.
| Author(s)Year CountryTechnique | Timing of CUS (days of life) | Parameter(s) | Quantitative echogenicity of PV WM based on its finalappearance | Standardtool usedfordiagnosis of PVL ornormal PV WM | Timing of finaldiagnosis of PVL or normalPV WM | ||
|---|---|---|---|---|---|---|---|
| Normal | Non-cystic PVL | Cystic PVL | |||||
| Simaeys et al. 2000 Belgium PBI22 | 0-7 | PBIPVWM/ PBICPa | 0.74±0.03 | 0.85±0.07 | NA | Post-mortem exam or MRI | NR |
| Fujimoto etal. 2003 Japan IBS23 | 0 | IBSPV WMb | 24.6±4.3 (ELBW);22.5±2.8 (VLBW);15.0±4.0 (LBW) | NA | NA | MRI (ELBW,VLBW), CT (LBW) | Before hospitaldischarge |
| Tenorio etal. 2011Spain TA16 | 3-7 | PVL scorec | <0.39 | ≥0.39 | CUS | 14 to 31 days of life | |
| Narchi et al. 2013 United Kingdom TA17 | 3.3 (range2-5) in patientswithout cysticPVL;2.6 (range1-4)in patients with cystic PVL | MDF1coronal;MDF2coronal;MDF1sagittal; MDF2sagittald | MDF1coronal <0.98; MDF2coronal ≥0.86; MDF1 sagittal <0.24; MDF2 sagittal <0.01 | MDF1coronal ≥0.98; MDF2 coronal <0.86; MDF1 sagittal ≥0.24;MDF2 sagittal ≥0.01 | CUS | 21 days of life (range13-42 days of life) in patientswithout cystic PVL°; 45 days of life (range 16-85 days) in patients withcystic PVL° | |
| ASM x103 | |||||||
| You et al. 2015 SouthKorea TA29 | 1.48±0.27(range 0-7) | ASM; IDM;Contrast; Entropy;Aver- age; SD; Skewness;Kurtosise | ASM x103 west-north1.519±0.456* (cut-off>1.378); IDM x103 west-east 448.651±84.344*;Contrast west-east24.393±9.376* (cut-off<25.5478); Entropy west-east 3.042±0.125* (cut-off <3.073089);Average 33.010±4.386;SD 45.947±3.577;Skewness 1.440±0.250;Kurtosis 1.842±1.072 | west-north1.739±1.204; IDMx103 west-east431.886±148.958;Contrast west-east28.644±25.099;Entropy west-east3.023±0.288;Average30.650±4.138;SD43.145±4.424;Skewness1.452±0.181;Kurtosis | ASM x103 west-north0.984±0.420* (cut-off<1.378); IDM x103 west-east 367.601±114.251*;Contrast west-east32.559±7.662* (cut-off>25.5478); Entropywest- east3.178±0.094* (cut- off >3.073089); Average32.394±7.881;SD45.507±7.790; Skewness1.461±0.415; Kurtosis1.981±2.558 | MRI | 35.9±4.7weeks’ PMA (range 27-52weeks’ PMA)§ |
| 1.987±0.996 | |||||||
°Statistically significant difference; *Statistically significant differences between patients with cystic PVL and normal PV WM; §The interval between birth and MRI in patients with cystic PVL was shorter than in the other groups
aCoronal plane through the glomus choroideum, side not specified; bParasagittal plane for measurement of the echogenicity of peritrigone deep
WM. There was no difference in the IBS value of each ROI between right and left cerebral hemispheres; cPV areas in a posterior coronal plane,
taken from the anterior fontanel with the transducer posteriorly oriented at around 45°, delineating a 1 to 1.5-cm perimeter surrounding the
trigone of the lateral ventricles and always avoiding GrM. CPs were sampled within the same plane, at the level of the posterior horns of the
lateral ventricles. PVL score was calculated as the projection of each individual vector of the image texture features on the imaging biomarker
to assign each individual to a single value; dROIs were positioned within the regions of WM PVE in both the sagittal and coronal planes. A series
of 305 numerical texture parameters were calculated for each image, based on three methods (co-occurrence matrix, run-length matrix, and
gradient matrix). From all the 305 parameters resulting from the three TA methods, only the parameters that represented a significant difference
between any two groups were tested for their discrimination ability by the Fisher (F)-coefficient which measures the ratio between-class variance
and within-class variance. The ten best TA parameters, defined by their F-coefficient for discrimination ability, were: three separate Sum Variance
and one Correlation parameters for co-occurrence matrix, four grey-level non-uniformity parameters (horizontal, vertical, slanted at 45 and 135
degrees) for run-length matrix, and Skewness and Kurtosis of absolute gradient for gradient matrix. These best ten selected features were then
entered iteratively into a LDA classifier function. LDA resulted in two new feature vectors called MDF 1 and 2, allowing the classification of the
two groups and the representation of that classification results as a point position on a graph with two axes (MDF1 and MDF2); eCoronal images
just posterior to the ventricular antrum, containing the WM over the occipital horns of the lateral ventricles, and a large ROI covering the bilateral WM were used. ASM x 103, IDM x 103, Contrast, and Entropy were significantly different between groups 1 and 3; none of the first-order
gray-level statistics (average, SD, skewness, and kurtosis) were significantly different between groups 1 and 3. Subgroup comparison revealed no
significant difference between groups 1 and 2 or groups 2 and 3. Thirty of 48 features showed a statistically significant difference between groups
1 and 3 (ASM in 9 directions, IDM in 6 directions, contrast in 3 directions, and entropy in all 12 directions).
Abbreviations: ASM: Angular Second Moment; CP: Choroid Plexus; CT: Computed Tomography; CUS: Cranial Ultrasound; ELBW: Extremely Low
Birth Weight; GrM: Grey Matter; IBS: Integrated Backscatter; IDM: Inverse Difference Moment; IRF: Intensity of Radio-Frequency; LBW: Low Birth
Weight; MDF: Most Discriminating Features; LDA: Linear Discriminant Analysis; MRI: Magnetic Resonance Imaging; NA: Not Assessed; NR: Not
Reported; PBI: Pixel Brightness Intensity; PMA: Postmenstrual Age; PV: Periventricular; PVE: Periventricular Echogenicity; PVL: Periventricular
Leukomalacia; ROI: Region of Interest; SD: Standard Deviation; TA: Texture Analysis; VLBW: Very Low Birth Weight; WM: White Matter.
Table 8: Risk of bias assessment for included cohort studies [30].
| Prospective/retrospective cohort studies | |||||
|---|---|---|---|---|---|
| A28 | B18 | C23 | D16 | ||
| Criteria | Was the research question or objective in this paperclearly stated? | Yes | Yes | Yes | Yes |
| Was the study population clearly specified and defined? | Yes | Yes | Yes | Yes | |
| Was the participation rate of eligible persons at least50%? | Yes | Yes | Yes | No | |
| Were all the subjects selected or recruited fromthe same or similar populations (including the same timeperiod)? Were inclusion and exclusion criteria for being in the studyprespecified and applied uniformlyto all participants? | CD | Yes | CD | Yes | |
| Was a sample sizejustification, power description, or variance and effect estimates provided? | No | No | No | Yes | |
| For the analyses in this paper,were the exposure(s) or interest measured prior to the outcome(s) beingmeasured? | Yes | CD | Yes | CD | |
| Was the timeframe sufficient so thatone could reasonably expect to see an association between exposure andoutcome if it existed? | No | No | Yes | Yes | |
| For exposures thatcan vary in amount or level, did the studyexamine different levelsof the exposure as related to the outcome (e.g., categories of exposure, orexposure measured as continuous vari- able)? | No | Yes | Yes | Yes | |
| Were the exposure measures (independent variables) clearly defined, valid,reliable, and implement- ed consistently across all study participants? | Yes | Yes | Yes | Yes | |
| Was the exposure(s) assessed more than onceover time? | NA | Yes | NA | No | |
| Were the outcomemeasures (dependent variables) clearly defined, valid,reliable, and implemented consistently across all study participants? | Yes | Yes | Yes | Yes | |
| Were the outcome assessors blinded to the exposure statusof participants? | Yes | Yes | CD | CD | |
| Was lossto follow-up afterbaseline 20% or less? | No | Yes | Yes | No | |
| Were key potential confounding variables measured and adjusted statistically for their impacton the relationship between exposure(s) andoutcome(s)? | No | Yes | No | Yes | |
| Poor | Poor | Poor | Poor | ||
| Quality rating(Good, Fair, Poor) | |||||
toFrom: NIH Quality Assessment Tool for Observational Cohort and Cross-Sectional Studies. Available online at https://www.nhlbi.nih.gov/
health-topics/study-quality-assessment-tools. [30]
References:
A. Pinto et al., 201228; B. Beller et al., 201518; C. Fujimoto et al., 200323; D. Tenorio et al., 201116.
Legends: CD: cannot determine; NA: not applicable.
Table 9: Risk of bias assessment for included cross-sectional studies [30].
| Cross-sectional study | ||
|---|---|---|
| Simaeys et al., 200022 | ||
| Criteria | Was the research question or objective in this paperclearly stated? | No |
| Was the study population clearly specified and defined? | No | |
| Was the participation rate of eligible persons at least50%? | CD | |
| Were all the subjects selected or recruited fromthe same or similar populations (including the sametime period)? Were inclusion and exclusion criteriafor being in the study prespecified and applied uniformly to allparticipants? | CD | |
| Was a sample sizejustification, power description, or variance and effect estimates provided? | No | |
| For the analyses in this paper,were the exposure(s) or interest measured prior to the outcome(s) beingmeasured? | Yes | |
| Was the timeframe sufficient so thatone could reasonably expect to see an association between exposure and outcomeif it existed? | Yes | |
| For exposures thatcan vary in amount or level, did the studyexamine different levelsof the exposure as related to theoutcome (e.g., categories of exposure, or exposure measured as continuousvariable)? | Yes | |
| Were the exposure measures (independent variables) clearly defined, valid,reliable, and implemented consistently acrossall study participants? | No | |
| Was the exposure(s) assessed more than onceover time? | NA | |
| Were the outcomemeasures (dependent variables) clearly defined, valid,reliable, and implemented consistently acrossall study participants? | No | |
| Were the outcome assessors blinded to the exposure statusof participants? | CD | |
| Was lossto follow-up afterbaseline 20% or less? | CD | |
| Were key potential confounding variables measured and adjusted statistically for their impacton the relationship between exposure(s) and outcome(s)? | No | |
| Poor | ||
| Quality rating(Good, Fair,Poor) | ||
From: NIH Quality Assessment Tool for Observational Cohort and Cross-Sectional Studies. Available online at https://www.nhlbi.nih.gov/healthtopics/study-quality-assessment-tools. [30].
Legends: CD: cannot determine; NA: not applicable
Table 10: Risk of bias assessment for included case-control studies [31]
| Case-control studies | ||||
|---|---|---|---|---|
| A24 | B17 | C29 | ||
| Criteria | Was the research question or objective in this paperclearly stated and appropriate? | Yes | Yes | Yes |
| Was the study population clearly specified and defined? | Yes | Yes | Yes | |
| Did theauthors include a sample sizejustification? | Yes | Yes | No | |
| Were controls selected or recruited fromthe same or similar population that gave riseto the cases(in- cluding the sametimeframe)? | Yes | Yes | Yes | |
| Were the definitions, inclusion and exclusion criteria, algorithms or processes usedto identify or select cases and controls valid, reliable, andimplemented consistently across all study participants? | No | No | Yes | |
| Were thecases clearly defined and differentiated fromcontrols? | Yes | Yes | Yes | |
| If less than100 percent of eligible casesand/or controls wereselected for the study, werethe cases and/orcontrols randomly selected from those eligible? | CD | CD | NA | |
| Was thereuse of concurrent controls? | CD | CD | No | |
| Were the investigators able to confirmthat the exposure/risk occurred prior to the development of the condition or event that defined aparticipant as a case? | Yes | Yes | Yes | |
| Were the measures of exposure/risk clearlydefined, valid, reliable, and implemented consistently (includ- ing thesame time period) across all study participants? | No | Yes | Yes | |
| Were the assessors of exposure/risk blinded to the caseor control statusof participants? | CD | Yes | CD | |
| Were key potential confounding variables measured and adjusted statistically in the analyses? If matching was used, did the investigators accountfor matching during study analysis? | No | Yes | Yes | |
| Poor | Poor | Fair | ||
| Quality rating(Good, Fair, Poor) | ||||
From: NIH Quality Assessment Tool for Case-Control Studies. Available online at https://www.nhlbi.nih.gov/health-topics/study-quality-assessment-tools.31
References
A. Hope et al., 200424; B. Narchi et al., 201317; C. You et al., 201529
Legends: CD: cannot determine; NA: not applicable.
Outcomes: As primary outcome, we assessed whether quantitative analysis of brain echogenicity in both preterm and term infants within 12 months of age could predict later neurodevelopmental outcome. The effectiveness of quantitative analysis of brain echogenicity within 14 days of postnatal age to predict the subsequent occurrence of cystic/non-cystic PVL or the absence of WM damage represented the secondary outcome. Quantitative echogenicity was defined as: a) absolute value, b) ratio between the echogenicity values of 2 brain regions, or c) difference between the echogenicity values of 2 brain regions.
Data extraction: The authors independently extracted data from the selected articles. A specifically designed form summarised the following data for each included article: authorship, publication year, country, study design, characteristics of the study population at baseline with statistically significant differences among the study groups, exclusion criteria, characteristics and settings of the ultrasound machine, timing of cranial ultrasonographic scans, characteristics of the ROI adopted in each study (plane, brain region, shape, area), software for quantitative analysis of brain echogenicity, results (absolute value of echogenicity, ratio or difference between the echogenicity values of 2 ROIs), interpretation of results (relationship between quantitative echogenicity and later neurodevelopmental outcome and/or WM appearance), risk of bias, and notes (Table 3). In case of differences among authors in data extraction, consensus was achieved by discussion. All data extracted from the selected articles were organized into four tables (Tables 4-7) [16-18,22-24,28,29]. Thereafter, studies were analysed in terms of variability in participants, acquisition of cranial ultrasonographic scans, details about quantitative analysis of brain echogenicity, and results. Finally, a separate subgroup analysis was conducted for each one of the two outcomes evaluated in our systematic review. Given the heterogeneity of patients and methods (acquisition of ultrasonographic scans, timing of acquisition, characteristics of ROI), a meta-analysis of the included studies was not feasible.
Risk of bias: The quality assessment of included studies was performed according to the criteria from the “National Institutes of Health (NIH) Quality Assessment Tool for Observational Cohort and Cross-Sectional Studies”, and the “NIH Quality Assessment Tool for Case-Control Studies” [30,31]. Both these tools for quality evaluation of clinical studies are available online at https://www.nhlbi.nih.gov/health-topics/study-quality-assessment-tools [30,31]. The “NIH Quality Assessment Tool for Observational Cohort and Cross-Sectional Studies”, and the “NIH Quality Assessment Tool for Case-Control Studies” included 14 and 12 items, respectively; for each item response options were “yes”, “no”, “cannot determine”, “not applicable”, and “not reported” [30,31]. The questions were designed to help reviewers focus on the key concepts for evaluating the internal validity of a study [30,31]. Thereafter, the study quality was judged as “good”, “fair” or “poor” based on the responses to the signalling questions and the relevance given to key concepts expressed in the signalling questions [30,31]. All the authors independently assessed risk of bias for each included article; when different opinions were found, consensus was reached after discussion.
Check of methodological quality: The check of the methodological quality of our systematic review was performed in accordance with the statements from the “Assessment of Multiple Systematic Reviews” (AMSTAR) too l32.
Results
Flow of studies: The study selection process is shown in the PRISMA flow diagram (Figure 1) [26]. A total of 56547 records were identified from four databases. After 56521 references were removed as duplicate (n=36147) or unrelated (n=20374) records, [26] studies remained for screening (Figure 1)26. Each reviewer screened the titles and abstracts of the articles, and [17] studies were excluded as not relevant (unrelated articles, n=4; studies with insufficient details/information, n=3; studies not fulfilling inclusion criteria [1-3], n=3; studies not fulfilling inclusion criterion 4, n=7). Nine references were further evaluated for eligibility: one out of 9 had insufficient details/information and was excluded. Finally, [8] studies met all inclusion criteria and were incorporated in our systematic review.
Characteristics of the included studies: Characteristics of the included studies are summarised in Table 4 [16-18,22- 24,28,29]. The studies were performed in [8] countries across North America, Europe and Asia (Canada 24, United States2 8, Belgium 22, Spain 16, United Kingdom 17, Israe 18, Japan 23, and South Korea 29) and were published between 2000 and 2015 [16-18,22-24,28,29]. As regards design, selected investigations included cross-sectional [22], case-control [17,24,29], retrospective28 and prospective cohort [16,18,23] studies. Four investigations out of 8 pointed out the role of quantitative analysis of brain echogenicity in the early prediction of neurodevelopmental outcome [18,23,24,28]. Three of these investigations had [2] or more study groups [23,24,28]; the study by Beller et al. had only one study group [18]. In total, 128 patients across the four studies have been included in the present systematic review [18,23,24,28]; infants belonging to group n. [1] of the study by Pinto et al. 28 and those belonging to group n. 4 of the study by Fujimoto et al. [23] have been excluded because their neurodevelopmental outcome was not clearly specified. Two studies out of [4] included both preterm and term infants23,28; the remaining two included only preterm newborns [18,24]. Where clearly expressed, birth weight (BW) ranged from 570 to 2358 g [18,23]. All the patients included across the 4 studies had known final outcome [18,23,24,28] and variable findings at CUS, MRI or Computed Tomography (CT), ranging from normal [18,23,24,28] to mild or moderate diffuse periventricular echogenicity (PVE) [18]. Regarding neurodevelopmental outcome, it was evaluated by means of the Lacey Assessment of The Preterm Infant (LAPI) administered prior to discharge after reaching the 35th week of gestation in the study by Beller et al. [18]; in the remaining investigations, the tool by which neurodevelopment has been evaluated was not specified [23,24,28]. Exclusion criteria resulted quite heterogeneous among the 4 studies [18,23,24,28]. Quantitative assessment of echogenicity has been used for early prediction of cystic/noncystic PVL or absence of WM damage in 5 of the included studies [16,17,22,23,29]. PVL was defined and scored according to the classification of de Vries et al.33 in the study by Tenorio et al. [16]; in the investigation by Narchi et al., parenchymal findings were classified as PVE, regressed PVE, or cystic PVL if echolucent bilateral periventricular cysts were detected in the same location where PVE had been seen [17]. In the study by You et al., patients were classified as having no WM injury, mild WM injury (≤5 areas with signal abnormalities measuring less than 2 mm in the periventricular WM on T1- or T2-weighted images), or severe WM injury (diffuse cystic/cavitary changes in the periventricular WM) [29]. The definition of PVL was not specified in the article by Simaeys et al. [22]. In the study by Fujimoto et al., IBS values at day 0 were provided only for newborns with normal deep WM at MRI or CT performed before hospital discharge: for this reason, a definition of PVL was not included in this study [23]. All these five investigations had two or more study groups and included a total of 158 participants [16,17,22,23,29]; patients belonging to study group n. 4 of the investigation by Fujimoto et al. were not included in the present systematic review because the final appearance of WM was not assessed in these infants [23]. Gestational age (GA) at birth of patients included in our systematic review was comprised between 22 and 37 weeks [16,17,23,29]; however, one study included also full-term newborns with BW < 2500 g [23]. GA at birth was not specified in the article by Simaeys et al. [22]. Where expressed, patients had normal findings16 and/or PVE [16,17] at enrollment. Apart from the study by Fujimoto et al., which included only patients without WM injury [23], the remaining investigations included both infants without WM damage and patients with various degrees of WM injury [16,17,22,29] at last assessment. Differences among the study groups were absent16, not reported [22,23] or not relevant [29]; however, in the study by Narchi et al., the age when the last ultrasonographic examination was performed was significantly older in patients with confirmed cystic PVL than in patients with resolution of PVE [17]. Exclusion criteria were not superimposable among the 5 studies [16,17,22,23,29]; however, patients with congenital or acquired brain abnormalities have been excluded in 3 articles [17,23,29].
Acquisition and analysis of ultrasonographic images: Details about acquisition and analysis of ultrasonographic images are summarised in Table 5. Studies pointing out the relationship between quantitative brain echogenicity and later neurodevelopment show a high level of heterogeneity in this field [18,23,24,28]. Ultrasound (US) machine was different across all included studies [18,23,24,28]. Machine settings were mostly operator-dependent [18,24,28]; however, in the study by Fujimoto et al., parameters were fixed [23]. Software for quantitative assessment of brain echogenicity was specified in only one study: in this case ImageJ Java was used by Authors [18]. ROIs were selected on the coronal plane in 2 studies [18,24]; in the investigations by Pinto et al. and Fujimoto et al., ROIs were chosen on the parasagittal plane [23,28]. Where clearly expressed, the surface of selected ROIs was kept constant [18,23]. As regards the shape of ROIs across the different studies, this one was variable (circular 18, oval 23, rectangular 24); in the investigation by Pinto et al., ROIs were ovoid for WM of the cingulate gyrus, and adapted to the anatomy of the cortex for grey matter (GrM) of the same region [28]. Even in the case of studies in which quantitative analysis of echogenicity has been used for early prediction of cystic/non-cystic PVL or absence of WM damage, details about acquisition of ultrasonographic images show a high level of heterogeneity [16,17,22,23,29]. US machine was different for all the included studies [16,17,22,23,29]; machine settings were fixed in the investigations by Simaeys et al.22 and Fujimoto et al. [23], and operator-dependent in the remaining 3 studies [16,17,29]. Software for quantitative analysis of brain echogenicity varied among the included studies [16,17,29]. ROIs were mostly selected on the coronal plane [16,17,22,29]. In 2 studies, images were selected on the parasagittal plane [17,23]; Narchi et al. analysed images even on the sagittal plane [17]. Where specified, the area of selected ROIs was variable [17,29]; however, in the investigation by Fujimoto et al. it was kept constant (11 x 11 pixels) [23]. The shape of ROIs was also variable across the included studies [rectangular 22, oval 23, coincident with the anatomical borders of periventricular WM and choroid plexuses (CPs) 16, squared 17], and approximately spherical 29.
Relationship between quantitative brain echogenicity and later neurodevelopment: Details about the relationship between quantitative brain echogenicity and later neurodevelopment are shown in Table 6. At present, no studies defining the relationship between quantitative brain echogenicity and later cognitive and language development have been published. As regards motor development, Hope et al. demonstrated that some textural parameters could differ based upon the patient outcome [24]. Particularly, normalized surface area (NSA)WM/ NSACP ratio was higher in patients with normal motor development when analysed with different techniques [DMM, Gabor T=3, and grey-level morphology (GM)]; even standard deviation of the intensity (STAT)WM/STATCP ratio analysed with Gabor T=7 was demonstrated to be higher in patients with normal motor development with respect to those with cerebral palsy24. Values of the aforementioned textural parameters for patients with normal motor development were as follows: DMM, NSAratio = 1.440-1.860; Gabor T=3, NSAratio = 1.190-1.730; GM, NSAratio = 1.350-1.800; Gabor T=7, STATratio = 2.190-3.35024. Similarly, range values for infants with cerebral palsy were the following ones: DMM, NSAratio = 0.740-1.330; Gabor T=3, NSAratio = 1.020-1.140; GM, NSAratio = 0.954-1.150; Gabor T=7, STATratio = 0.780-1.37024. Furthermore, the difference between NSAWM and NSACP (NSAdiff) was higher in patients with normal motor development when analysed with DMM, Gabor T=7, and GM24. Values of these textural parameters for patients with normal motor development were as follows: DMM, NSAdiff = 1.580-3.100; Gabor T=7, NSAdiff = 351-1023; GM, NSAdiff = 1.840-4.05024. At the same time, range values for infants with cerebral palsy were the following ones: DMM, NSAdiff = -0.450- 0.650; Gabor T=7, NSAdiff = -231-149; GM, NSAdiff = -0.350- 0.99024. In the study by Fujimoto et al., echogenicity values for deep WM, subcortical WM, CP, thalamus, lateral ventricle and occipital bone in extremely low birth weight (ELBW), very low birth weight (VLBW), and low birth weight (LBW) infants were calculated by means of IBS at day 0 and 28 days after birth [23]. Results demonstrated that the differences among BW groups were statistically significant for all brain regions except for the lateral ventricle at both the first and second scan [23]. Furthermore, a decrease of IBS values was seen at day 28 compared to those at day 0 in ELBW and VLBW infants in all ROIs except for subcortical WM in VLBW patients and occipital bone [23]. Echogenicity values for deep WM, subcortical WM, CP, thalamus, lateral ventricle and occipital bone for all the 3 BW groups at both the first and second scan are shown in Table 6; reported values were calculated on patients with normal neurodevelopment up to 6-12 months of age [23]. Pinto et al. demonstrated that a sample of patients with normal initial and follow-up neurological examinations had a WM/GrM ratio at level of the cingulate gyrus, calculated by means of PBI within the 6th day of life, equal to 1.234±0.15928. Finally, Beller et al. found that echogenicity of fronto-parietal WM relative to bone (FP WM/BN) at 2-5 weeks of life negatively correlated with the motor, neurological and developmental LAPI scores [18]. At the same time, the echogenicity of parieto-occipital WM relative to bone (POWM/BN) beyond the 6th week of life negatively correlated with the motor and developmental predischarge LAPI scores [18]. Relative values of WM echogenicity were calculated by means of PBI; observed values were 42.6±9.1 for FP WM/BN between the 2nd and 5th week of life, and 42.3±6.5 for PO WM/BN beyond the 6th week of life [18].
Relationship between quantitative echogenicity of periventricular WM in the first 2 weeks of life and later WM appearance: Data about the relationship between quantitative echogenicity of periventricular WM within the 14th day of life and later diagnosis of cystic/non-cystic PVL or absence of WM damage are shown in Table 7. Data demonstrate that it is possible to predict later WM appearance starting from quantitative analysis of periventricular echodensity in the first 2 weeks of life; however, this was true for single studies, considered that the high variability in methods and results across the included investigations prevented us to draw out more general conclusions through a meta-analysis [16,17,22,23,29]. Fujimoto et al. showed through IBS that the mean echogenicity of periventricular WM at day 0 ranged from 15.0 to 24.6 dB in patients without WM damage, and this value was higher in ELBW infants and lower in LBW newborns [23]. TA was used in 3 further studies [16,17,29]. Tenorio et al. demonstrated that a PVL score lower than 0.39 could permit to discriminate patients without WM damage from those with later cystic/non-cystic PVL16. Narchi et al. demonstrated that Most Discriminant Factor (MDF) 1 on the coronal plane < 0.98, MDF2 on the coronal plane ≥ 0.86, MDF1 on the sagittal plane < 0.24, and MDF2 on the sagittal plane < 0.01 could permit to discriminate patients with normal WM or non-cystic PVL from those with cystic PVL17. In the investigation by You et al., some textural parameters [angular second moment (ASM) west-north, inverse difference moment (IDM) west-east, contrast west-east, entropy westeast] were demonstrated to discriminate between patients without WM damage and those who will develop cystic PVL [29]. Particularly, ASMx103 west-north >1.378, contrast west-east < 25.5478, and entropy west-east < 3.073089 were predictive of normal WM appearance; on the contrary, ASMx103 west north < 1.378, contrast west-east >25.5478, and entropy westeast >3.073089 were found in patients with later occurrence of cystic PVL [29]. Infants without WM damage had higher IDMx103 west-east values than patients who will develop cystic PVL (448.651±84.344 vs 367.601±114.251) [29]. Totally, thirty of 48 features showed a statistically significant difference between patients without WM damage and those with cystic PVL (ASM in 9 directions, IDM in 6 directions, contrast in 3 directions, and entropy in all 12 directions); however, numerical values were not reported for all of them [29]. None of the first-order graylevel statistics (average, standard deviation, skewness, and kurtosis) were significantly different between patients without WM damage and those with later occurrence of cystic PVL [29]. As regards PBI, Simaeys et al. demonstrated that periventricular WM/CP ratio was 0.74±0.03 for patients without WM damage, and 0.85±0.07 for infants with non-cystic PVL; however, these values could not distinguish unequivocally the 2 categories of patients [22].
Risk of bias: Data about risk of bias for included studies are shown in Tables [8-10,16-18,22-24,28,29]. As regards the studies about the relationship between quantitative brain echogenicity and later neurodevelopment, their quality was classified as poor [18,23,24,28]. The study by Fujimoto et al. was categorised as poor because we could not determine if outcome assessors were blinded to the characteristics of the participants, and the impact of key potential confounding variables on results was not assessed [23]. Furthermore, this study did not include infants with neurodevelopmental impairment, and the way in which neurodevelopmental outcome has been assessed was not specified [23]. This last flaw is present even in the studies by Pinto et al. and Hope et al. [24,28]. Regarding the study by Pinto et al., it was not expressed the time in which neurodevelopmental outcome was evaluated, thus raising some concerns that it could have been assessed too early [28]. Furthermore, loss to follow-up after baseline was more than 20%, and we could not determine whether control subjects have been selected during the same time period [28]. In the study by Hope et al., the process used to identify cases and controls was not implemented consistently across all study participants; furthermore, we could not assess whether cases and controls have been randomly selected from those eligible or not [24]. We could not even determine if outcome assessors were blinded to the case or control status of participants [24]. The study by Beller et al. was well conducted; furthermore, this one was the only investigation in which the tool for neurodevelopmental assessment has been reported [18]. However, neurodevelopment has been examined predischarge after having reached the 35th week of postmenstrual age: this too early neurodevelopmental assessment raises some concerns about the results of this study [18].
As regards the investigations about the relationship between quantitative echogenicity of WM and its later appearance, the quality was mostly poor [16,17,22,23]; only the study by You et al. was classified as fair [29]. Concerns about the investigation by Fujimoto et al. have already been discussed previously; furthermore, this study did not include infants with WM damage [23]. In the study by Tenorio et al., the participation rate of eligible patients was less than 50%, thus raising some concerns that the studied population could not be representative of all eligible infants [16]. Furthermore, even in this case, we could not determine if outcome assessors were blinded to the status of participants [16]. Regarding the study by Simaeys et al., its quality was poor as the study population and its characteristics were not clearly defined, and we could not assess the participation rate of eligible patients [22]. Furthermore, it is not clear if outcome assessors were blinded to the status of participants [22]. Finally, we could not even determine if all subjects were selected from the same or similar population and if inclusion and exclusion criteria were applied uniformly to all participants [22]. In the study by Narchi et al., cases were diagnosed with cystic PVL at 45 days of life (mean 16-85 days), whereas controls were classified as such at 21 days of life (mean 13-42 days of life): in the last case, timeframe could not be sufficient to unequivocally exclude cystic PVL [17]. Given that this could have influenced the results of the study, this was classified as poor [17]. The investigation by You et al. was classified as fair even if we could not surely determine whether outcome assessors were blinded or not to the case or control status of participants [29].
Discussion
Outcomes
This systematic review shows that quantitative analysis of brain echogenicity could be useful in early prediction of neurodevelopmental outcome [18,23,24,28] and later WM appearance in newborns [16,17,22,23,29]. Unfortunately, considered the wide heterogeneity of the included studies, a meta-analysis of these articles was not feasible and conclusions came from single investigations [16-18,22-24,28,29]. Furthermore, most of the included studies had small sample size and/or additional methodological issues that severely impede us to draw out robust conclusions [16-18,22-24,28,29]. As regards early prediction of neurodevelopmental outcome, PBI is the most promising technique in this field, with FP WM/BN and PO WM/BN ratios being the 2 parameters which better correlate with neuromotor status at term [18]. According to Beller et al., the echogenicity of frontoparietal periventricular WM should be measured at the 5th angled coronal plane at the level of the trigone of the lateral ventricles [18]. Similarly, quantitative evaluation of the echogenicity of parieto-occipital periventricular WM should be performed on the 6th angled coronal plane through the parieto-occipital lobes [18]. Notably, the results of quantitative assessment of periventricular WM should be expressed relatively to the echogenicity of bony calvarium at the same level as the studied ROI [18]. Finally, the Authors asserted that no significant differences were detectable between right and left hemisphere of the brain [18]. The best timing for assessment of FP WM/BN ratio is between the second and fifth week of postnatal age, whereas PO WM/BN ratio is more representative of later neurodevelopmental outcome if measured beyond the sixth week after birth [18]. In particular, these findings have been validated on patients with normal CUS or non-cystic PVL throughout their NICU stay and evaluated by means of the LAPI assessment tool before discharge [18]. However, these results came from the study by Beller et al., which is penalised by the absence of a long-term follow-up, and have been validated on infants with GA at birth < 34 weeks [18]. Recently, we calculated the echogenicity of parieto-occipital periventricular WM relative to that of homolateral CP on parasagittal scans by means of PBI and demonstrated its negative correlation with Bayley-III cognitive, language, and motor composite scores at 12months’ corrected age [34]. We showed that this association was statistically significant since the 14th postnatal day on patients with GA at birth < 32 weeks [34]. Unfortunately, this research did not fulfil criteria for inclusion in the present systematic review. Analysis of currently available literature points out that the prognostic significance of hyperechoic changes in periventricular WM is less predictable than that of cystic lesions, and seems to depend on whether the abnormality resolves promptly or persists for several weeks [3]; the duration of hyperechogenicities could even correlate with the severity of injury, as well as with long-term outcome [3,35-37]. For this reason, serial ultrasonographic examinations, as performed by Beller et al., could represent the most valid approach [18]. No reliable studies clearly define the role of quantitative analysis of brain echogenicity in early prediction of neurodevelopment in term infants, including those with perinatal asphyxia. Even Pinto et al. chose PBI to measure WM/GrM ratio at level of the cingulate gyrus [28]. However, the purpose of this study was to determine whether this marker differed between term neonates with perinatal asphyxia and age-matched healthy controls [28]. Given that results about neurodevelopmental outcome of infants with asphyxia are not presented in this article, we cannot distinguish between infants that will show neurodevelopmental abnormalities and those who will have normal neurodevelopment based on WM/GrM ratio, thus the usefulness of this marker in the assessment of later neurodevelopmental outcome is still undefined [28]. The Authors did not specify the way in which neurodevelopmental assessment has been done in healthy patients, nor did they indicate the hemisphere in which WM/GrM ratio has been measured [28]: both these issues could reduce the robustness of results and limit the reproducibility of the experiment. In addition, CUS was performed within the first 6 days of life (mean 2.63 days after birth) [28]: we think this timing is too early to ensure reliable results and a growing body of medical research supports this statement. The first ultrasonographic equivalent of hypoxic-ischemic brain damage occurring in the perinatal period is constituted by the appearance of periventricular hyperechogenicity which, however, does not take place before 3 days of life [38]. Thus, CUS examination performed in the first week of life may have a reduced sensitivity in detecting cerebral insults, especially if carried out in the first 3 days after birth. Ill newborns could be unstable in the first days of life, thus CUS performed after this period could also account for postnatal injuries and add valuable information. In the study by Fujimoto et al., IBS was used to calculate the mean echogenicity value of different brain regions, including both deep and subcortical WM [23]. However, all enrolled patients had no neurodevelopmental abnormalities up to 6-12 months of age: the absence of reference values for patients with neurodevelopmental impairment prevents us to properly distinguish between infants that will manifest neurodevelopmental abnormalities from those who will not [23]. In addition, the Authors did not specify on which basis neurodevelopmental outcome was defined as normal, thus limiting the reproducibility of the study results [23]. Indeed, the purpose of this investigation was to demonstrate that IBS could be used as an objective method for evaluating the echo density in the normal neonatal brain based on BW, GA at birth, and postnatal age 23. Hope et al. provided range values for the difference between WM and CP, and for WM/CP ratio calculated by means different techniques of TA for infants with normal motor outcome and those with cerebral palsy [24]. However, timing of CUS was not specified and further methodological issues (e.g., small sample size, absence of a clearly defined selection process for included patients, indefinite criteria for assessment of motor outcome, lack of adjustment of statistical analysis for confounding variables) raise concerns about the accuracy of the study results [24]. In view of the findings from the included investigations, PBI appears a promising technique to assess quantitative brain echogenicity and its relationship with later neurodevelopmental outcome. Considered the easiness of measurement of FP WM/ BN and PO WM/BN, both markers could be used in daily clinical practice; however, further studies of good quality are needed to confirm the benefit of PBI and its role in early prediction of long-term neurodevelopmental outcome in both preterm-born and term-born infants, including those with perinatal asphyxia. With regard to the relationship between quantitative echogenicity of periventricular WM and its later appearance, the results of our systematic review demonstrate that TA is the most studied technique in this field [16,17,29]. Results point out that ASM, contrast, and especially entropy allow to distinguish between infants without WM damage and those who will develop cystic PVL. This finding comes from the study by You et al., which even provides cut-off values for some of these gray-level co-occurrence matrix textural parameters able to separate the 2 categories of patients [29]. PVL score, and MDF1 and MDF2 on both coronal and sagittal planes could be helpful to identify patients with later occurrence of non-cystic PVL [16,17]. However, some methodological issues (participation rate of eligible patients less than 50% [16], outcome assessors not surely blinded to the results of quantitative analysis of the echogenicity of periventricular WM [16], process used to select cases and controls not clearly explained [17]) impede us to currently promote the use of the aforementioned parameters and force us to clas- sify the quality of the corresponding studies as poor. In addition, in the study by Narchi et al., patients were definitely diagnosed with cystic PVL at 45 days of life (range 16-85 days), whereas controls were classified as such at 21 days of life (range 13-42 days): this statistically significant difference could have influenced the results of the investigation [17]. Given that this argument strongly prevents us to recommend the use of MDF1 and MDF2, we could not even suggest the application of PVL score because it is not able to differentiate alone between patients with non-cystic PVL and those who will develop cystic PVL [16]. Furthermore, the procedures used to early identify WM damage in the study by Tenorio et al. and in the investigation by Narchi et al. could be time-consuming and difficult to apply in the daily clinical context. The study by You et al. was classified as fair as regards quality; however, it neither allows to distinguish between patients without WM injury and those with noncystic PVL, nor enables to discern between infants with noncystic PVL and those with cystic PVL [29]. Data from our systematic review suggest that early prediction of WM appearance by means of TA is possible since the first week of life [16,17,22,23,29]. ASM, contrast, and entropy should be measured on coronal images just posterior to the ventricular antrum, containing the WM over the occipital horns of the lateral ventricles, and within a large ROI covering the bilateral WM [29]. Even Jung et al. used TA to perform their investigation; particularly, they measured variance-to-mean ratio between two consecutive ultrasonographic scans to discriminate patients without cystic PVL from those who will develop it [39]. However, the second scan was performed after the 14th day of life in most patients [39]: given that cysts typically take 2 to 6 weeks to appear and we were interested in early diagnosis of WM damage in order to implement preventive interventions, the study by Jung et al. was not included in the present systematic review [3]. As regards the role of PBI and IBS in early prediction of WM appearance, results were limited [22,23]. The study by Simaeys et al. did not demonstrate a statistically significant difference of periventricular WM/CP ratio, in terms of PBI, between patients without WM damage and those with non-cystic PVL; thus, this investigation should be considered inconclusive [22]. The study by Fujimoto et al. included only patients without WM injury: for this reason, we could not define for which values of echogenicity of periventricular WM, calculated by means of IBS, we should expect later occurrence of cystic and non-cystic PVL [23]. Because of its advantages, CUS is complementary to MRI and is usually performed since the first days of life [3]. For this last reason, brain ultrasonography could influence clinical decision making and induce the beginning of preventive or therapeutic neuroprotective interventions. Assessment of WM injury is difficult because periventricular hyperechogenicity is a subjective finding [3]. In general, echogenicity is considered pathological when it is equal to or greater than that of CP [3]. However, in extremely immature babies the use of this reference is questionable due to the more prominent and echoic CP in this population and also the fact that cystic PVL can be observed following flaring that never exceeded the brightness of the plexus [3]. Thus, quantitative brain echogenicity, and particularly quantitative assessment of periventricular WM, could contribute in solving these issues. Indeed, the results of our systematic review suggested that quantitative assessment of brain echogenicity could provide further information about tissue characterization and later development; however, additional studies are required to enhance the knowledge into this field. Particularly, given that cystic and non-cystic PVL could correlate with different degrees of neurodevelopmental impairment [3], early identification of patients with both these lesions should be pursued. Finally, this review suggested that early detection of WM injuries is possible since the first week of life by means of TA [29], whereas PBI offers the opportunity to predict later neurodevelopment since the 2nd week after birth [18].
Risk of bias: Considering that the quality of most of the included studies is low [16-18,22-24,28], our results need to be confirmed by means of further studies of good quality. If we take into account only investigations of fair or good quality, TA could be the only technique providing reliable results and no studies investigating the relationship between quantitative brain echogenicity and later neurodevelopment lead to robust achievements. However, the study by Beller et al. is mainly penalised by the absence of a long-term follow-up [18]. For these reasons, we think that both TA and PBI could be valid techniques for the assessment of quantitative brain echogenicity. Unpublished data represent a potential source of bias we should take into account when interpreting the results of our systematic review. Given the possibility that studies suggesting a relationship between quantitative brain echogenicity and one or both the outcomes of our systematic review are more likely to be published than data pointing in the opposite direction, our systematic review of the published studies could lead to spurious findings. In addition, some potentially eligible articles belonging to the grey literature or written in languages other than English might not have been included in the present systematic review. However, our search of unpublished studies was unfruitful.
Strenghts and limitations: We have tried to give an overview over such an important topic for neonatologists, that is obtaining the maximum possible information from CUS, by means of a clear search strategy involving multiple databases and even the search of unpublished data. However, our systematic review has some limitations. First of all, our population of interest was quite heterogeneous. In the same way, the variability of image acquisition and quantitative analysis of ultrasonographic scans did not allow us to perform a meta-analysis of the included studies. Furthermore, some potentially eligible articles belonging to the grey literature might not have been selected for inclusion in the present systematic review. The small sample size of all included articles [16-18,22-24,28,29], together with other factors (e.g., absence of multicenter studies) limit the possibility to generalize the results of the studies. The inclusion of only English articles could have introduced a language bias considering that studies with positive results are likely published in English [27].
Conclusion
Our systematic review points out that 3 different techniques have been used to predict later occurrence of WM damage in newborns within their first 14 days of life [16,17,22,23,29]; the same techniques have also been used for early prediction of neurodevelopmental outcome [18,23,24,28]. Among these techniques, PBI and TA appear promising; however, further studies of good quality are needed to confirm our findings. The purpose of further investigations will also be to define the role of quantitative analysis of brain echogenicity in the clinical context. Our systematic review has contributed to identify a limited number of parameters (e.g., FP WM/BN, PO WM/BN, entropy) which could be included in a structured protocol for evaluation of brain damage in newborns. Quantitative analysis of brain echogenicity could permit to identify patients at risk of WM injury and/or neurodevelopmental impairment and start early neuroprotective interventions [40,41].
Declarations
Ethics approval and consent to participate: Not applicable as systematic review of published literature.
Consent for publication: The publication of the present manuscript is approved by all the authors and explicitly by the responsible authority where the work has been carried out.
Availability of data and materials: The original contributions presented in the systematic review are included as figures or tables. Further data and materials will be made available by the corresponding author on reasonable request.
Competing interests: The authors declare they have no competing interests that are relevant to the content of this article.
Funding: The authors declare the research was performed without any financial or non-financial support.
Authors’ contribution: All authors have made substantial contributions to all of the following: 1) conception and design of the study, or acquisition of data, or analysis and interpretation of data; 2) drafting the article or revising it critically for important intellectual content; 3) final approval of the version to be submitted. Particularly, Gianluigi Laccetta contributed in conception and design of the work, acquisition of data and their analysis and interpretation; he also drafted the article. Maria Di Chiara, Maria Chiara De Nardo, Raffaella Cellitti, Alberto Spalice, and Gianluca Terrin contributed in acquisition of data and their analysis and interpretation; they also critically revised the work. Finally, all authors approved the version of the work to be submitted.
Acknowledgements: Not applicable.
References
- Van Meurs KP, Yan ES, Randall KS, Chock VY, Davis AS, et al. Development of a NeuroNICU with a Broader Focus on All Newborns at Risk of Brain Injury: The First 2 Years. Am J Perinatol. 2018; 35(12): 1197-1205. doi: 10.1055/s-0038-1646954.
- Hwang M, Tierradentro-García LO, Hussaini SH, Cajigas-Loyola SC, Kaplan SL, et al. Ultrasound imaging of preterm brain injury: Fundamentals and updates. Pediatr Radiol 2022; 52(4): 817- 836. doi: 10.1007/s00247-021-05191-9.
- Agut T, Alarcon A, Cabañas F, Bartocci M, Martinez-Biarge M, et al. Preterm white matter injury: ultrasound diagnosis and classification. Pediatr Res 2020; 87(l-1): 37-49. doi: 10.1038/s41390- 020-0781-1.
- Volpe JJ. Cerebral white matter injury of the premature infantmore common than you think. Pediatrics. 2003; 112(1-1): 176- 180. doi: 10.1542/peds.112.1.176.
- Dyet LE, Kennea N, Counsell SJ, Maalouf EF, Ajayi-Obe M, et al. Natural history of brain lesions in extremely preterm infants studied with serial magnetic resonance imaging from birth and neurodevelopmental assessment. Pediatrics 2006; 118(2): 536- 548. doi: 10.1542/peds.2005-1866.
- Inder TE, Wells SJ, Mogridge NB, Spencer C, Volpe JJ. Defining the nature of the cerebral abnormalities in the premature infant: a qualitative magnetic resonance imaging study. J Pediatr. 2003; 143(2): 171-179. doi: 10.1067/S0022-3476(03)00357-3.
- Horsch S, Hallberg B, Leifsdottir K, Skiöld B, Nagy Z, et al. Brain abnormalities in extremely low gestational age infants: a Swedish population-based MRI study. Acta Paediatr. 2007; 96(7): 979- 984. doi: 10.1111/j.1651-2227.2007.00294. x.
- Hamrick SE, Miller SP, Leonard C, Glidden DV, Goldstein R, et al. Trends in severe brain injury and neurodevelopmental outcome in premature newborn infants: The role of cystic periventricular leukomalacia. J Pediatr. 2004; 145(5): 593-599. doi: 10.1016/j. jpeds.2004.05.042.
- Back SA, Miller SP. Brain injury in premature neonates: A primary cerebral dysmaturation disorder? Ann Neurol. 2014; 75(4): 469-486. doi: 10.1002/ana.24132.
- Perrone S, Grassi F, Caporilli C, Boscarino G, Carbone G, et al. Brain Damage in Preterm and Full-Term Neonates: Serum Biomarkers for the Early Diagnosis and Intervention. Antioxidants (Basel). 2023; 12(2): 309. doi: 10.3390/antiox12020309.
- Bobba PS, Malhotra A, Sheth KN, Taylor SN, Ment LR, et al. Brain injury patterns in hypoxic ischemic encephalopathy of term neonates. J Neuroimaging. 2023; 33(1): 79-84. doi: 10.1111/ jon.13052.
- Pisani F, Spagnoli C. Monitoring of newborns at high risk for brain injury. Ital J Pediatr. 2016; 42(1): 48. doi: 10.1186/s13052- 016-0261-8.
- Starr R, De Jesus O, Shah SD, Borger J. Periventricular and Intraventricular Hemorrhage. [Updated 2023 Mar 11]. In: StatPearls [Internet]. Treasure Island (FL): StatPearls Publishing; 2023. https://www.ncbi.nlm.nih.gov/books/NBK538310/.
- Liu L. Application of brain ultrasound in premature infants with brain injury. Front Neurol. 2023; 14: 1095280. doi: 10.3389/ fneur.2023.1095280.
- Hagmann CF, Halbherr M, Koller B, Wintermark P, Huisman T, et al. Swiss Neonatal Network. Interobserver variability in assessment of cranial ultrasound in very preterm infants. J Neuroradiol. 2011; 38(5): 291-297. doi: 10.1016/j.neurad.2010.12.008.
- Tenorio V, Bonet-Carne E, Botet F, Marques F, Amat-Roldan I, et al. Correlation between a semiautomated method based on ultrasound texture analysis and standard ultrasound diagnosis using white matter damage in preterm neonates as a model. J Ultrasound Med. 2011; 30(10): 1365-1377. doi: 10.7863/ jum.2011.30.10.1365.
- Narchi H, Mahmoud-Ghoneim D, Skinner A, Cogings P. Texture analysis of periventricular echogenicity on neonatal cranial ultrasound predicts periventricular leukomalacia. J Neonatal Perinatal Med. 2013; 6(2): 117-124. doi: 10.3233/NPM-1365012.
- Beller T, Peylan T, Ben Sira L, Shiran SI, Levi L, et al. Quantitative analysis of cranial ultrasonographic periventricular echogenicity in relation to early neuromotor development in preterm infants. Arch Dis Child Fetal Neonatal Ed. 2016; 101(3): 217-222. doi: 10.1136/archdischild-2015-308216.
- Ichihashi K, Yada Y, Takahashi N, Homma Y, Momoi M. Integrated backscatter of the brain of preterm infants. J Perinat Med. 2008; 36(3): 253-255. doi: 10.1515/JPM.2008.036.
- Ichihashi K, Yada Y, Takahashi N, Honma Y, Momoi M. Analysis of the intensity of radio-frequency signals in intracranial ultrasonography of preterm infants. J Med Ultrason (2001). 2008; 35(2): 57. doi: 10.1007/s10396-007-0171-x.
- Varghese BA, Cen SY, Hwang DH, Duddalwar VA. Texture Analysis of Imaging: What Radiologists Need to Know. AJR Am J Roentgenol. 2019; 212(3): 520-528. doi: 10.2214/AJR.18.20624.
- Simaeys B, Philips W, Lemahieu I, Govaert P. Quantitative analysis of the neonatal brain by ultrasound. Comput Med Imaging Graph. 2000; 24(1): 11-18. doi: 10.1016/s0895-6111(99)00041- 5.
- Fujimoto C, Yamashita Y, Kanda H, Harada E, Maeno Y, et al. In vivo quantitative ultrasonic evaluation of neonatal brain with a real time integrated backscatter imaging system. Brain Dev. 2003; 25(6): 411-415. doi: 10.1016/s0387-7604(03)00032-9.
- Hope T, Gregson P, Linney N, Schmidt M. Ultrasonic tissue characterization as a predictor of white matter damage: results of a preliminary study. IEEE Ultrasonics Symposium 2004, Montreal, QC, Canada. 2004; 3: 2157-2160. doi: 10.1109/ULTSYM.2004.1418265.
- Moher D, Liberati A, Tetzlaff J, Altman DG. PRISMA Group. Preferred reporting items for systematic reviews and meta-analyses: the PRISMA statement. PLoS Med. 2009; 6(7): 1000097. doi: 10.1371/journal.pmed.1000097.
- Page MJ, McKenzie JE, Bossuyt PM, Boutron I, Hoffmann TC, et al. The PRISMA 2020 statement: an updated guideline for reporting systematic reviews. BMJ 2021; 372: 71. doi: 10.1136/ bmj.n71.
- Higgins JPT, Green S (editors). Cochrane Handbook for Systematic Reviews of Interventions Version 5.1.0 [updated March 2011]. The Cochrane Collaboration. 2011. Available from www.handbook.cochrane.org.
- Pinto PS, Tekes A, Singhi S, Northington FJ, Parkinson C, et al. White-gray matter echogenicity ratio and resistive index: sonographic bedside markers of cerebral hypoxic-ischemic injury/edema? J Perinatol. 2012; 32(6): 448-453. doi: 10.1038/ jp.2011.121.
- You SK, Choi YH, Park SJ, Cheon JE, Kim IO, et al. Quantitative Sonographic Texture Analysis in Preterm Neonates with White Matter Injury: Correlation of Texture Features with White Matter Injury Severity. J Ultrasound Med. 2015; 34(11): 1931-1940. doi: 10.7863/ultra.15.01031.
- National Institutes of Health (NIH) Quality Assessment Tool for Observational Cohort and Cross-Sectional Studies. Available online at https://www.nhlbi.nih.gov/health-topics/study-qualityassessment-tools.
- National Institutes of Health (NIH) Quality Assessment Tool for Case-Control Studies. Available online at https://www.nhlbi.nih. gov/health-topics/study-quality-assessment-tools.
- Shea BJ, Grimshaw JM, Wells GA, Boers M, Andersson N, et al. Development of AMSTAR: a measurement tool to assess the methodological quality of systematic reviews. BMC Med Res Methodol. 2007; 7: 10. doi: 10.1186/1471-2288-7-10.
- De Vries LS, Eken P, Dubowitz LM. The spectrum of leukomalacia using cranial ultrasound. Behav Brain Res. 1992; 49(1): 1-6. doi: 10.1016/s0166-4328(05)80189-5.
- Laccetta G, Di Chiara M, De Nardo MC, Tagliabracci M, Travaglia E, et al. Quantitative ultrasonographic examination of cerebral white matter by pixel brightness intensity as marker of middleterm neurodevelopment: a prospective observational study. Sci Rep. 2023; 13(1): 16816. doi: 10.1038/s41598-023-44083-w.
- Jongmans M, Henderson S, de Vries L, Dubowitz L. Duration of periventricular densities in preterm infants and neurological outcome at 6 years of age. Arch Dis Child 1993; 69(1): 9-13. doi: 10.1136/adc.69.1_spec_no.9.
- Ancel PY, Livinec F, Larroque B, Marret S, Arnaud C, et al. 2006; 117(3): 828-835. doi: 10.1542/peds.2005-0091.
- Pellicer A, Cabañas F, García-Alix A, Pérez Rodriguez J, et al. Natural history of ventricular dilatation in preterm infants: prognostic significance. Pediatr Neurol. 1993; 9(2): 108-114. doi: 10.1016/0887-8994(93)90044-d.
- Schneider J, Miller SP. Preterm brain Injury: White matter injury. Handb Clin Neurol. 2019; 162: 155-172. doi: 10.1016/B978-0- 444-64029-1.00007-2.
- Jung HN, Suh SI, Park A, Kim GH, Ryoo I. Early Prediction of Periventricular Leukomalacia Using Quantitative Texture Analysis of Serial Cranial Ultrasound Scans in Very Preterm Infants. Ultrasound Med Biol. 2019; 45(10): 2658-2665. doi: 10.1016/j.ultrasmedbio.2019.06.413.
- Molloy EJ, El-Dib M, Juul SE, Benders M, Gonzalez F, et al. Newborn Brain Society Guidelines and Publications Committee. Neuroprotective therapies in the NICU in term infants: present and future. Pediatr Res. 2022. 10.1038/s41390-022-02295-2. doi: 10.1038/s41390-022-02295-2.
- Siahanidou T, Spiliopoulou C. Pharmacological Neuroprotection of the Preterm Brain: Current Evidence and Perspectives. Am J Perinatol. 2022; 39(5): 479-491. doi: 10.1055/s-0040-1716710.