
Journal of Clinical Images and Medical Case Reports
ISSN 2766-7820
Research Article - Open Access, Volume 6
Muscle quantity, quality and dynamics in metastatic colorectal cancer patients during third-line therapy with regorafenib or TAS102
Chiara Maddalena1; Andrea Ponsiglione2; Luigi Camera2; Dario Bruzzese3; Mariarosaria D’Amato4; Chiara Carlomagno5*
1ASL Napoli 3 Sud, Ospedale Nuovo Gragnano, Italy.
2Department of Advanced Biomedical Sciences, University of Naples Federico II, Italy.
3Department of Public Health, University of Naples Federico II, Italy.
4UOC Oncology, Fondazione Casa Sollievo della Sofferenza, Italy.
5Department of Clinical Medicine and Surgery, University of Naples Federico II, Italy.
*Corresponding Author : Chiara Carlomagno
Associate Professor, Department of Clinical Medicine
and Surgery, University of Naples Federico II, Via
Pansini 5-80131, Naples, Italy.
Tel: +390817464271;
Email: chiara.carlomagno@unina.it
Received : Jan 08, 2025
Accepted : Feb 04, 2025
Published : Feb 11, 2025
Archived : www.jcimcr.org
Copyright : © Carlomagno C (2025).
Abstract
Introduction: Regorafenib and TAS-102 showed similar efficacy as third- or subsequent-line treatment in Metastatic ColoRectal cancer (mCRC) patients. The aim of our study was to analyze the occurrence of sarcopenia and Skeletal Muscle Loss (SML) in mCRC patients during Regorafenib or TAS102 treatment.
Materials and methods: Our retrospective analysis included 22 mCRC patients in third-line therapy with Regorafenib or TAS-102. Muscle tissue was evaluated at L3 level by CT scans and sarcopenia was assessed using Skeletal Mass Index [SMI=muscle area at L3 in cm2/ (height in m)2].
Results: Mean±SD age was 67.7±9.8. 12/22 patients received Regorafenib, and 10/22 TAS102. 9/22(40.9%; 6M, 3F) patients were sarco- penic and 6/20 (30%; 2M, 4F) patients had low Muscle Attenuation (MA) at baseline CT. Sarcopenic patients had lower BMI (p=0.016) while patients with low MA had higher BMI (p=0.02) than patients with normal muscle. Baseline sarcopenia wasn’t associated with OS (p=0.231), PFS (p=0.541), and ORR (p=0.644). Also, MA wasn’t associated with OS (p=0.172), PFS (p=0.6) and ORR (p=1). No association was found with toxicities. Most commonly reported side effects were asthenia and HFS with Regorafenib, and neutropenia with TAS-102. 90% of patients had a dose reduction at second cycle of TAS-102, compared to 41.7% of patients treated with Regorafenib (p=0.031). 8/22 patients reported SML>5%: 6/12 patients in Regorafenib group, while 2/10 patients in TAS-102 group (p=0.204). 68.2% patients experienced muscle wasting, but SML wasn’t associated to OS (p=0.307) and ORR (p=0.781). One patient receiving TAS-102 experienced a 10.7% increase in muscle mass.
Conclusion: Baseline sarcopenia, MA and SML during third-line therapy with Regorafenib or TAS102 did not influence survival, ORR and toxicities. SML>5% was more frequent in patients receiving Regorafenib, although the difference wasn’t statistically significant. These results must be interpreted with caution due to limited sample size.
Keywords: Muscle mass quantity and quality; Skeletal muscle loss; Skeletal muscle index; Muscle attenuation; Body mass index.
Citation: Maddalena C, Ponsiglione A, Camera L, Bruzzese D, Carlomagno C, et al. Muscle quantity, quality and dynamics in metastatic colorectal cancer patients during third-line therapy with regorafenib or TAS102. J Clin Images Med Case Rep. 2025; 6(2): 3462.
Introduction
Colorectal cancer is the third most common malignancy worldwide with 1.1 million new cases each year and is the second leading cause of cancer death [1]. Approximately 15-30% of patients have metastases at the time of diagnosis, while 20-50% of patients with initially localized disease will develop metastases [2].
Almost 40% of Metastatic Colorectal Cancer (mCRC) patients are able to receive third-line therapy [3]. National and international guidelines (AIOM [4], ESMO [2], NCCN [5]) recommend the use of Regorafenib or Trifluridine/Tipiracil (TAS 102) in mCRC patients from the third line of treatment. Unfit patients for intensive chemotherapy can also receive Regorafenib or TAS-102 as second line of treatment [4].
Regorafenib is an oral inhibitor of protein kinases that are involved in tumor angiogenesis (VEGFR1, -2, -3, TIE2), oncogenesis (KIT, RET, RAF-1, BRAF, BRAFV600E) and tumor microenvironment (PDGFR and FGFR). The Phase III CORRECT study [5] reported a Median Overall Survival (mOS) of 6.4 months in the Regorafenib group versus 5.0 months in the placebo group (HR 0.77; 95% CI 0.64-0.94; p=0.0052) in pretreated mCRC patients.
TAS-102 is a combination of Trifluridine, a thymidine-based nucleic acid analogue, and Tipiracil hydrochloride, an inhibitor of thymidine phosphorylase. Trifluridine, after several metabolic processes, is incorporated into the DNA, thus interfering with cell proliferation. Tipiracil hydrochloride prevents the rapid degradation of Trifluridine by thymidine phosphorylase, allowing maintenance of adequate plasma levels of the active drug. In the pivotal RECOURSE trial [6], mOS was 7.1 months in the TAS-102 group versus 5.3 months in the placebo group (HR 0.68; 95% CI 0.58-0.81; p<0.001) in pretreated mCRC patients.
Currently there is no recommendation regarding a preference between Regorafenib and TAS-102 and no phase III trials compared these two drugs in pretreated mCRC patients. In clinical practice, the choice of which drug to administer is conditioned by the drug toxicity profile and the patient’s performance status.
In the retrospective study REGOTAS [7] no difference in efficacy was found between Regorafenib and TAS-102 in patients with mCRC, refractory to standard chemotherapy. However, time to treatment failure was longer in the TAS-102 group than in the Regorafenib group (HR, 0.81; 95% CI, 0.68-0.97; p=0.025). Toxicity profile was different, as TAS-102 more frequently caused hematological toxicities, in particular neutropenia, compared to Regorafenib, which, instead, mainly caused hand-foot syndrome and asthenia.
Two retrospective studies [8,9] estimated baseline sarcopenia and Skeletal Muscle Loss (SML) during therapy in mCRC patients receiving Regorafenib or TAS-102, comparing the effect of these two drugs on muscle mass. Both studies demonstrated greater muscle loss in the Regorafenib group than in the TAS-102 group. Moreover, Humer et al. [8] found that 92% of patients experienced muscle loss during third-line Regorafenib, while 75% of patients experienced muscle gain during subsequent fourth-line treatment with TAS-102. In this study, basal sarcopenia, but not SML, was associated with OS. On the contrary, Hacioglu et al. [9] showed that SML was an independent prognostic factor for OS, but, although patients who received Regorafenib had more SML than those who received TAS-102, there was no difference in OS between these two drug groups.
Several studies, regardless of the type of therapy, demonstrated that low muscle mass (sarcopenia) before initiating therapy [10-14], low muscle attenuation, that indicates poor muscle quality due to fat infiltration [14,15], and skeletal muscle loss during treatment [16-19] were all negative prognostic factors in mCRC patients. The aim of our study was to analyze the prognostic role of muscle mass quantity, quality, and dynamics in mCRC patients treated with Regorafenib or TAS102 as third line therapy.
Materials and methods
This is a retrospective cohort study that included 22 (11 M, 11 F) consecutive mCRC patients in third-line therapy with Regorafenib or TAS-102 from 2016 to 2021. The study was conducted in accordance with the 2013 Declaration of Helsinki, and it was approved by the decision #446/21 of Federico II University Ethics Committee in Naples (Italy) on January 12, 2022.
Were considered eligible mCRC patients who had received third-line therapy with Regorafenib or Trifluridine/Tipiracil (TAS- 102) and whose CT-scans, performed before third-line beginning and then at first disease reassessment, were available in our archive. Regorafenib was either prescribed at oral dose of 160 mg once daily on days 1-21 of each cycle of 28 days [20] or at a starting dose of 80 mg per day with weekly dose escalation to a target dose of 160 mg [21]. TAS-102 was provided orally twice a day at a dose of 35 mg/m2 5 days a week, with 2 days of rest, for 2 weeks, followed by a rest of 14 days, and repeated every 4 weeks [6]. All patients had been treated and progressed to therapy with fluorouracil, oxaliplatin, or irinotecan, anti-VEGF (anti-Vascular Endothelial Growth Factor) and/ or anti-EGFR (anti-Epidermal Growth Factor Receptor), in case of RAS wild-type status.
Aims of the study
The principal aim of our study was to access the prognostic impact of basal sarcopenia and basal Muscle Attenuation (MA) on Overall Survival (OS), Progression Free Survival (PFS), Objective Response Rate (ORR) and toxicities (cycle delay, dose reduction and moderate/severe toxicities) in metastatic colorectal cancer patients in third-line therapy with Regorafenib or Trifluridine/Tipiracil (TAS-102). Other end-points were: to explore the relationship between muscle features and age, sex, Body Mass Index (BMI) and inflammatory blood tests; to evaluate the association between the type of third-line therapy and Skeletal Muscle Loss (SML) >5% at first Computed Tomography (CT) assessment; to investigate the potential effect of SML on OS and ORR; and to examine the correlation of weight loss ≥8% at first reassessment with OS, ORR and third-line type of drug.
Skeletal muscle mass measurements
CT scans were performed at baseline before starting third-line therapy and at first disease reassessment (after 2 or 3 cycles of treatment). The images were analyzed by subspecialty trained abdominal radiologists (AP, LC). Muscles (psoas, erector spinae, quadratus lumborum, transversus abdominus, external and internal obliques, and rectus abdominus) were quantified within a Hounsfield Unit (HU) range of -29 to 150 HU, evaluated on pre-contrast axial CT images at third lumbar vertebrae with a slice thickness of 5 mm, using the open-source Horos software (version 3.3.6) [22,23]. Sarcopenia was assessed with the Skeletal Mass Index [SMI = cross-sectional area in cm2 of all skeletal muscles at L3/ (height in m)2] [13,14,23,24]. We used cut-offs proposed by Martin [14] for skeletal muscle mass measurements. Sarcopenia was diagnosed with SMI <43 cm2/m2 for men with BMI <25 kg/m2, <53 cm2/m2 for men with BMI ≥25 kg/m2 and <41 cm2/m2 for women regardless of BMI [14]. Low skeletal MA, caused by fat infiltration into muscle tissue, was defined by HU values: <41 HU with BMI <25 kg/m2 and <33 HU with BMI ≥25 kg/m2, regardless of sex [14]. A loss of skeletal muscle mass >5% from baseline CT to first disease reassessment was considered indicative of a deterioration in muscle condition [17,25]. We indicated weight loss cut off ≥8% at first disease reassessment as possible risk factor for worse prognosis [14].
Outcomes
To assess the impact of sarcopenia and MA, OS was calculated from the start of third-line therapy to death or until the last outpatient visit; while PFS was measured from the start of third-line therapy to disease progression or death. On the other hand, to assess the impact of SML and weight loss, OS1 was calculated from the date of CT at first disease reassessment to death or until the last outpatient visit. Disease status was determined using the Response Evaluation Criteria in Solid Tumors (RECIST) version 1.1. Toxicities were analyzed during the first two or three cycles of therapy (between basal CT and first reassessment) and graded according to the Common Terminology Criteria for Adverse Events (CTCAE) version 4.0.
Patient stratification
atients were categorized as follows: male vs female; age (<75 vs ≥75 years) and BMI (underweight <18.5 kg/m2; normal weight ≥18.5 and <25 kg/m2; overweight 25-30 kg/m2 and obese >30 kg/m2). We analyzed the following blood tests as inflammatory markers: hemoglobin (<12 g/dl vs ≥12 g/dl); white blood cells (<10000/mm3 vs ≥10000/mm3); lymphocytes (<1200/mm3 vs ≥1200/mm3); Neutrophils/Lymphocytes Ratio (NLR, <3 vs ≥3); lactate dehydrogenase (LDH, <400 mU/ml vs ≥400 mU/ml); albumin (<3 g/dl vs ≥3 g/dl) [26].
Statistical analysis
All the statistical analyses were performed by a biomedical statistician using R statistical platform (ver. 4.1.2). Demographical and clinical characteristics of the cohorts were described using standard descriptive statistics: mean ± Standard Deviation (SD) with range or median [25th; 75th percentile] with range in case of numerical variables and absolute frequencies with percentages in case of categorical factors. The differences between groups were assessed using the t test for independent samples, the Mann-Whitney U test or the Fisher exact test. Time-to-event outcome (OS and PFS) were described using survival curves estimated using the Kaplan–Meier method and the log-rank test was used to quantify the evidence for differences between groups. Univariate Cox regression models were used to estimate Hazard Ratios (HRs) with the corresponding 95% Confidence Intervals (95% CIs).
Results
Mean±SD age was 67.7±9.8 (range: 49.7 to 84.9); 5/22 patients (22.73%) were ≥75 years old. 12/22(54.5%) patients received Regorafenib, while 10/22(45.5%) TAS102. Median duration of third line was 2.9 months (range: 1.33 to 25.7) for Regorafenib vs 4.8 months (range: 2.0 to 17.4) for TAS-102. Patient’s characteristics are reported in (Table 1). Median OS was 16.5 months (95% CI: 11.9 to 25.5 months) (Figure 1), while median PFS was 3.8 months (95% CI: 3.3 to 9.7 months) (Figure 1). 9/22 (40.9%; 6 M, 3 F) patients were sarcopenic and 6/20 (30%; 2 M, 4 F) patients had low MA at baseline CT (Table 2). MA could not be calculated for two patients due to poor quality of CT images. Body composition measurements are shown in (Table 2). Baseline sarcopenia wasn’t associated with OS (11.9 vs 16.8 months, sarcopenic vs non sarcopenic respectively; HR: 1.78 95% CI 0.69 to 4.59; p=0.231) (Figure 2), PFS (3.37 vs 3.93 months, sarcopenic vs non sarcopenic respectively; HR: 1.31 95% CI 0.54 to 3.18; p=0.541) (Figure 2) and response to treatment (p=0.644) (Table 3). Also, MA wasn’t associated with OS (16.8 vs 11.9 months with vs without low MA respectively; p=0.172) (Figure 3), PFS (3.3 vs 3.8 with vs without low MA respectively; p=0.6) (Figure 3) and response to treatment (p=1) (Table 4). Neither baseline sarcopenia nor low baseline muscle attenuation showed association with toxicities experienced in the first 2-3 cycles of third line therapy (Table 5 & Table 6 respectively). Two patients receiving Regorafenib discontinued therapy after the second cycle: one patient for treatment toxicities, such as asthenia, hypertransaminasemia and hand-foot syndrome, and one patient for disease progression. Moderate/ severe toxicities were different into the two therapy groups: patients into Regorafenib group mainly reported asthenia and hand-foot syndrome, while patients into TAS-102 group mainly reported neutropenia (Table 7). Moreover, 90% of patients treated with TAS-102 had a reduction in the drug dose before starting the second cycle of therapy compared to 41.7% of patients treated with Regorafenib (p=0.031). No relationship was found with age (2/9 sarcopenic patients vs 3/13 non-sarcopenic patients were ≥75 years old, p=1; 2/6 patients with low MA vs 2/14 patients without low MA were ≥75 years old, p=0.549) and sex (6/9 sarcopenic patients vs 5/13 non-sarcopenic patients were male, p=0.387; 2/6 patients with low MA vs 9/14 patients without low MA were male, p=0.336) (Table 8 & Table 9). BMI distribution was 0% underweight, 1/22(4.5%) normal weight, 13/22(59.1%) overweight and 8/22(36.4%) obese (Table 10). Mean±SD baseline BMI was 29.1±2.6 (26.0 to 33.6) in male patients and 30.6±6.1 (19.5 to 39.7) in female patients. Only one patient had a basal BMI <25 kg/m2; this patient also had sarcopenia, but not low MA, on baseline CT (Table 2). Basal sarcopenia and low MA were significantly associated with basal BMI: sarcopenic patients had lower BMI (27.2±3.5 vs 31.7±4.5 kg/m2; p=0.016) while patients with low MA, that indicates a high infiltration of fatty tissue into the muscle, had higher BMI (34.1±4.9 vs 28.1±3.7 kg/m2; p=0.02) than patients with normal muscle quantity and quality, respectively (Table 8 & Table 9). Only three patients had concomitant baseline sarcopenia and low MA: two of them were overweight, while one of them was obese. Baseline sarcopenia wasn’t associated with inflammatory blood tests (Table 11). At first disease reassessment, after 2-3 cycles of third-line therapy, 11/22 patients were sarcopenic of whom 8/11 patients were already sarcopenic at baseline, while 3/11 patients became sarcopenic and all three of these patients showed a SML >5%.
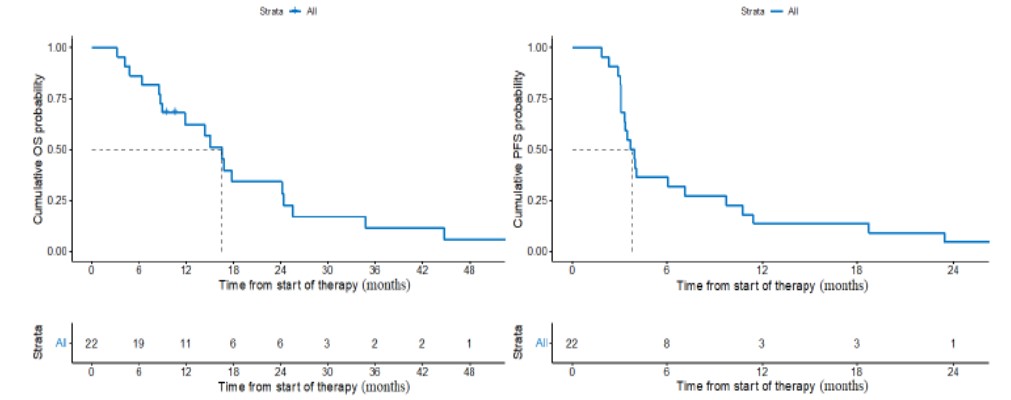
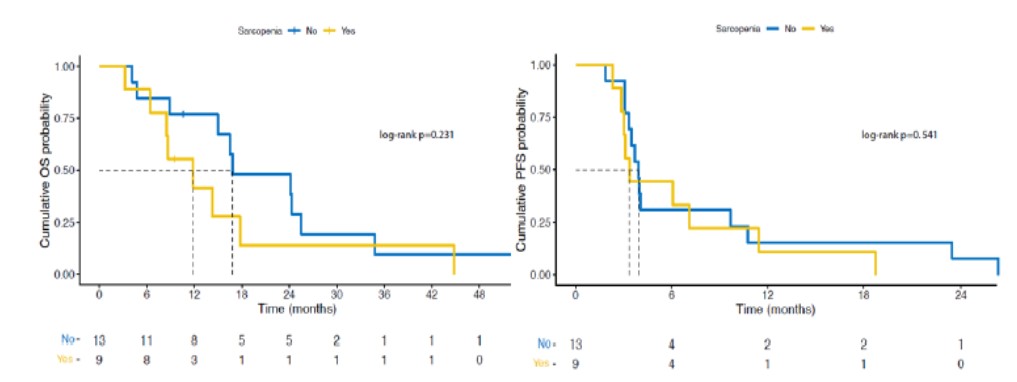
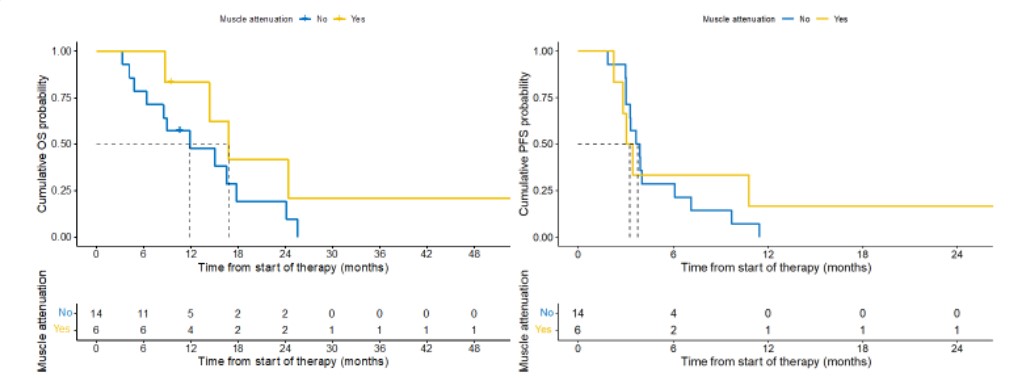
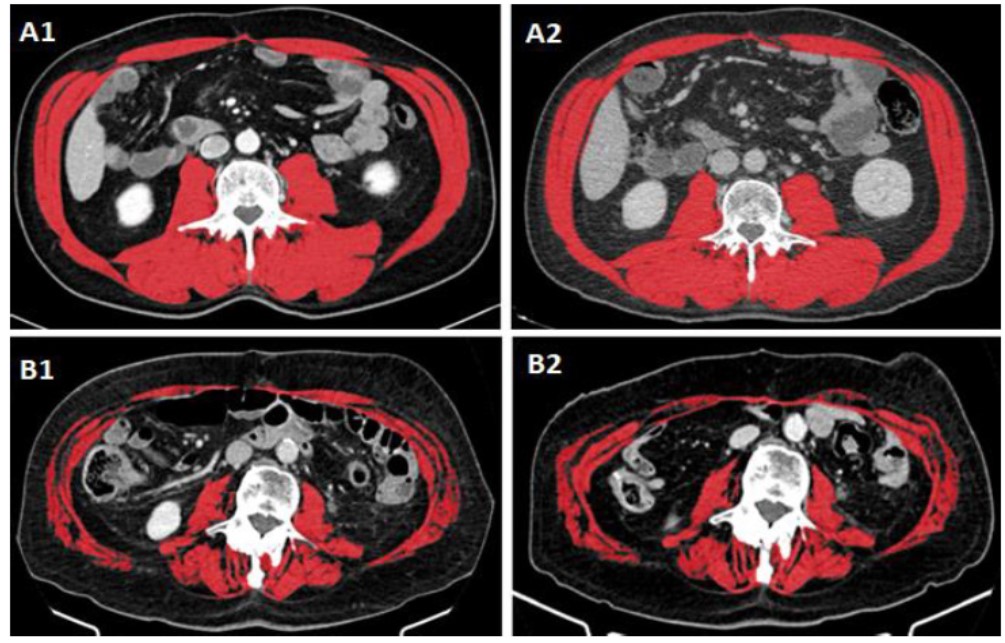
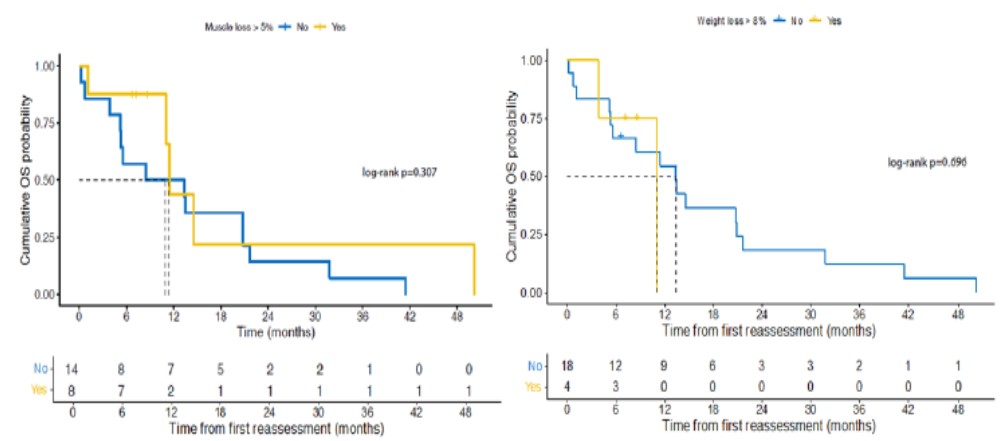
Table 1: Patients characteristics.
| Overall Cohort (n=22; 100%) |
Regorafenib (n=12; 54.5%) |
TAS-102 (n=10; 45.5%) |
|
|---|---|---|---|
| Age at 3rd line therapy | 67.7±9.8 (49.7 to 84.9) |
68.1±10.6 (49.7 to 84.6) |
67.1±9.3 (55.0 to 84.9) |
| Sex | |||
| Female | 11 (50) | 6 (50) | 5 (50) |
| Male | 11 (50) | 6 (50) | 5 (50) |
| Primary Tumor Location | |||
| Right colon + hepatic flexure | 7 (31.8) | 3 (25) | 4 (40) |
| Left colon + splenic flexure | 4 (18.2) | 3 (25) | 1 (10) |
| Sigmoid | 7 (31.8) | 3 (25) | 4 (40) |
| Rectum | 4 (18.2) | 3 (25) | 1 (10) |
| Stage at first diagnosis | |||
| Limited | 13 (59.1) | 7 (58.3) | 6 (60) |
| Metastatic | 9 (40.9) | 5 (41.7) | 4 (40) |
| KRAS status | |||
| Mutated | 14 (63.6) | 8 (66.7) | 6 (60) |
| Wild Type | 8 (36.4) | 4 (33.3) | 4 (40) |
| Duration of third line (months) | 3 [2.5; 8] (1.3 to 25.7) |
2.9 [2.5; 5.7] (1.3 to 25.7) |
4.8 [2.5; 12.1] (2.0 to 17.4) |
| Number of cycles from the beginning of the 3rd line to first disease reassessment | |||
| 3 cycles | 20 (90.9) | 10 (83.3) | 10 (100) |
| 2 cycles | 2 (9.1) | 2 (16.7) | 0 (0) |
| Time from the beginning of the 1st line to the ending of the 3rd line (months) | 20.4 [15.8; 33.3] (8.9 to 45.7) |
18.9 [15.6; 32.3] (13.1 to 45.7) |
24.1 [16; 36.2] (8.9 to 38.0) |
Table 2: Body composition measurements.
| Overall Cohort (n=22; 100%) |
Regorafenib (n=12; 54.5%) |
TAS-102 (n=10; 45.5%) |
|
|---|---|---|---|
| Baseline sarcopenia | 9/22 (40.9) | 4/12 (33.3) | 5/10 (50) |
| Sarcopenia at 1st reassessment | 11/22 (50) | 6/12 (50) | 5/10 (50) |
| Baseline low MA* | 6/20 (30) | 5/12 (41.7) | 1/8 (12.5) |
| Low MA at 1st reassessment* | 8/20 (40) | 6/12 (50) | 2/8 (25) |
| Weight loss ≥8% | 4/22 (18.2) | 4/12 (33.3) | 0/10 (0) |
| Baseline BMI <25 kg/m2 | 1/22 (4.5) | 0/12 (0) | 1/10 (10) |
| BMI <25 kg/m2 at 1st reassessment | 3/22 (13.6) | 2/12 (16.7) | 1/10 (10) |
| SML>5% | 8/22 (36.4) | 6/12 (50) | 2/10 (20) |
MA: Muscle Attenuation; BMI: Body Mass Index; SML: Skeletal muscle loss.
*MA could not be calculated for two patients due to poor quality CT images.
Table 3: Objective response rate according to baseline sarcopenia.
| Sarcopenia (n=22; 100o/o) | |||
|---|---|---|---|
| ORR | NO (n=13; 59.1%) | YES (n=9; 40.9%) | p-value |
| 0.644 | |||
| PR | 1 (7.7) | 0 (0) | |
| SD | 3 (23.1) | 4 (44.4) | |
| PD | 9 (69.2) | 5 (55.6) | |
ORR: Objective response Rate; PR: Partial Response; SD: Stable Disease; PD: Progression Disease.
Table 4: Objective response rate according to baseline sarcopenia.
| Low Muscle Attenuation (n=20; 100o/o) | |||
|---|---|---|---|
| ORR | NO (n=14; 70%) | YES (n=6; 30%) | p-value |
| 1 | |||
| PR | 0 (0) | 0 (0) | |
| SD | 4 (28.6) | 2 (33.3) | |
| PD | 10 (71.4) | 4 (66.7) | |
ORR: Objective Response Rate; PR: Partial Response; SD: Stable Disease; PD: Progression Disease.
Table 5: Objective response rate according to baseline sarcopenia.
| Toxicities | Sarcopenia | P value | ||
|---|---|---|---|---|
| Overall (n=22) | No (n=13; 59.1%) | Yes (n=9; 40.9%) | ||
| 1st cycle | ||||
| Anemia | 0(0) | 0(0) | 0(0) | na |
| Neutropenia | 2(9.1) | 1(7.7) | 1(11.1) | 1 |
| Thrombocytopenia | 0(0) | 0(0) | 0(0) | na |
| Asthenia | 10(45.5) | 7(53.8) | 3(33.3) | 0.4 |
| Hypertransaminasemia | 0(0) | 0(0) | 0(0) | na |
| Nausea | 1(4.5) | 0(0) | 1(11.1) | 0.409 |
| Diarrhea | 0(0) | 0(0) | 0(0) | na |
| HFS | 6(27.3) | 5(38.5) | 1(11.1) | 0.333 |
| 2nd cycle | ||||
| Dose reduction | 8(36.4) | 4(30.8) | 4(44.4) | 0.662 |
| Cycle delay | 8(36.4) | 5(38.5) | 3(33.3) | 1 |
| Anemia | 0(0) | 0(0) | 0(0) | na |
| Neutropenia | 5(22.7) | 1(7.7) | 4(44.4) | 0.116 |
| Thrombocytopenia | 0(0) | 0(0) | 0(0) | na |
| Asthenia | 11(50) | 6(46.2) | 5(55.6) | 1 |
| Hypertransaminasemia | 1(4.5) | 0(0) | 1(11.1) | 0.409 |
| Nausea | 3(13.6) | 2(15.4) | 1(11.1) | 1 |
| Diarrhea | 1(4.5) | 1(7.7) | 0(0) | 1 |
| HFS | 4(0) | 3(23.1) | 1(11.1) | 0.674 |
| 3rd cycle | Overall (n=20) | No (n=12;60%) | Yes (n=8;40%) | |
| Dose reduction | 6(30) | 2(16.7) | 4(50) | 0.161 |
| Cycle delay | 11(55) | 5(41.7) | 6(75) | 0.197 |
| Anemia | 0(0) | 0(0) | 0(0) | na |
| Neutropenia | 6(30) | 5(41.7) | 1(12.5) | 0.325 |
| Thrombocytopenia | 0(0) | 0(0) | 0(0) | na |
| Asthenia | 8(40) | 5(41.7) | 3(37.5) | 1 |
| Hypertransaminasemia | 1(5) | 1(8.3) | 0(0) | 1 |
| Nausea | 2(10) | 1(8.3) | 1(12.5) | 1 |
| Diarrhea | 0(0) | 0(0) | 0(0) | na |
| HFS | 9(45) | 6(50) | 3(37.5) | 0.671 |
We considered moderate/severe toxicities (grade 2-3-4 according Common Terminology Criteria for Adverse Events). HFS: Hand-Foot Syndrome.
*Two patients (one with sarcopenia and one without sarcopenia) discontinued the therapy after the second cycle
Table 6: Toxicities according to low baseline Muscle Attenuation (MA).
| Toxicities | Low Muscle Attenuation | P value | ||
|---|---|---|---|---|
| Overall (n=20) | No (n=14; 70%) | Yes (n=6; 30%) | ||
| 1st cycle | ||||
| Anemia | 0(0) | 0(0) | 0(0) | na |
| Neutropenia | 2(10) | 1(7.1) | 1(16.7) | 1 |
| Thrombocytopenia | 0(0) | 0(0) | 0(0) | na |
| Asthenia | 9(45) | 5(35.7) | 4(66.7) | 0.336 |
| Hypertransaminasemia | 0(0) | 0(0) | 0(0) | na |
| Nausea | 1(5) | 1(7.1) | 0(0) | 1 |
| Diarrhea | 0(0) | 0(0) | 0(0) | na |
| HFS | 6(30) | 5(35.7) | 1(16.7) | 0.613 |
| 2nd cycle | ||||
| Dose reduction | 8(40) | 5(35.7) | 3(50) | 0.642 |
| Cycle delay | 8(40) | 6(42.9) | 2(33.3) | 1 |
| Anemia | 0(0) | 0(0) | 0(0) | na |
| Neutropenia | 4(20) | 2(14.3) | 2(33.3) | 0.267 |
| Thrombocytopenia | 0(0) | 0(0) | 0(0) | na |
| Asthenia | 11(55) | 6(42.9) | 5(83.3) | 0.157 |
| Hypertransaminasemia | 1(5) | 1(7.1) | 0(0) | 0.521 |
| Nausea | 3(15) | 3(21.4) | 0(0) | 0.529 |
| Diarrhea | 1(5) | 0(0) | 1(16.7) | 0.294 |
| HFS | 9(45) | 5(35.7) | 4(66.7) | 0.336 |
| 3rd cycle * | Overall (n=18) | No (n=13; 72.2%) | Yes (n=5; 27.8%) | |
| Dose reduction | 5(27.8) | 3(23.1) | 2(40) | 0.249 |
| Cycle delay | 10(55.6) | 6(46.2) | 4(80) | 0.608 |
| Anemia | 0(0) | 0(0) | 0(0) | na |
| Neutropenia | 4(22.2) | 3(23.1) | 1(20) | 1 |
| Thrombocytopenia | 0(0) | 0(0) | 0(0) | na |
| Asthenia | 7(38.9) | 3(23.1) | 4(80) | 0.047 |
| Hypertransaminasemia | 2(11.1) | 1(7.7) | 1(20) | 0.469 |
| Nausea | 2(11.1) | 2(15.4) | 0(0) | 1 |
| Diarrhea | 1(5.6) | 0(0) | 1(20) | 0.294 |
| HFS | 9(50) | 5(38.5) | 4(80) | 0.294 |
We considered moderate/severe toxicities (grade 2-3-4 according Common Terminology Criteria for Adverse Events). HFS: Hand-Foot Syndrome.
*Two patients (one with low MA and one without low MA) discontinued the therapy after the second cycle.
Table 7: Toxicities according to the type of third-line therapy.
| Toxicities | Therapy | P value | ||
|---|---|---|---|---|
| Overall (n=22) | Regorafenib (n=12; 54.5%) | TAS-102 (n=10; 45.5%) | ||
| 1st cycle | ||||
| Anemia | 0(0) | 0(0) | 0(0) | na |
| Neutropenia | 2(9.1) | 0(0) | 2(20) | 0,195 |
| Thrombocytopenia | 0(0) | 0(0) | 0(0) | na |
| Asthenia | 10(45.5) | 7(58.3) | 3(30) | 0,231 |
| Hypertransaminasemia | 0(0) | 0(0) | 0(0) | na |
| Nausea | 1(4.5) | 1(8.3) | 0(0) | 1 |
| Diarrhea | 0(0) | 0(0) | 0(0) | na |
| HFS | 6(27.3) | 6(50) | 0(0) | 0,015 |
| 2nd cycle | ||||
| Dose reduction | 14(63.6) | 5(41.7) | 9(90) | 0,031 |
| Cycle delay | 14(63.6) | 6(50) | 8(80) | 0,204 |
| Anemia | 0(0) | 0(0) | 0(0) | na |
| Neutropenia | 5(22.7) | 0(0) | 5(50) | 0,01 |
| Thrombocytopenia | 0(0) | 0(0) | 0(0) | na |
| Asthenia | 11(50) | 10(83.3) | 1(10) | 0,002 |
| Hypertransaminasemia | 1(4.5) | 1(8.3) | 0(0) | 1 |
| Nausea | 3(13.6) | 2(16.7) | 1(10) | 1 |
| Diarrhea | 1(4.5) | 1(8.3) | 0(0) | 1 |
| HFS | 9(40.9) | 9(75) | 0(0) | <0.001 |
| 3nd cycle | ||||
| Dose reduction | 6(30) | 3(30) | 3(30) | 1 |
| Cycle delay | 11(55) | 6(60) | 5(50) | 1 |
| Anemia | 0(0) | 0(0) | 0(0) | na |
| Neutropenia | 6(30) | 0(0) | 6(60) | 0,011 |
| Thrombocytopenia | 0(0) | 0(0) | 0(0) | na |
| Asthenia | 7(35) | 6(60) | 1(10) | 0,057 |
| Hypertransaminasemia | 0(0) | 0(0) | 0(0) | na |
| Nausea | 2(10) | 1(10) | 1(10) | 1 |
| Diarrhea | 0(0) | 0(0) | 0(0) | na |
| HFS | 9(45) | 8(80) | 1(10) | 0,005 |
We considered moderate/severe toxicities (grade 2-3-4 according Common Terminology Criteria for Adverse Events). HFS: Hand-Foot Syndrome.
*Two patients receiving Regorafenib discontinued the therapy after the second cycle.
Table 8: Relationship between baseline sarcopenia and age, sex and BMI.
| Sarcopenia | ||||
|---|---|---|---|---|
| Overall (n=22) | No (n=13; 59.1%) | Yes (n=9; 40.9%) | P value | |
| Age | 67.7±9.8 (49.7 to 84.9) |
68.3±10.5 (49.7 to 84.9) |
66.7±9.1 (54.5 to 78.2) |
0,71 |
| Age ≥75 Y | 5(22.7) | 3(23.1) | 2(22.2) | 1 |
| Male gender | 11(50) | 5(38.5) | 6(66.7) | 0,387 |
| BMI | 29.9±4.7 (19.5 to 39.7) |
31.7±4.5 (25.1 to 39.7) |
27.2±3.5 (19.5 to 32.7) |
0,016 |
BMI: Body Mass Index.
Table 9: Relationship between baseline muscle attenuation and age, sex and BMI.
| Low muscle attenuation | ||||
|---|---|---|---|---|
| Overall (n=20) | No (n=14; 70%) | Yes (n=6; 30%) | P value | |
| Age | 67.7±9.8 (49.7 to 84.9) |
65.9±9.8 (49.7 to 84.6) |
69.1±9 (53.5 to 78.2) |
0,491 |
| Age ≥75 Y | 4(20) | 2(14.3) | 2(33.3) | 0,549 |
| Male gender | 11(55) | 9(64.3) | 2(33.3) | 0,336 |
| BMI | 29.9±4.7 (19.5 to 39.7) |
28.1±3.7 (19.5 to 34.1) |
34.1±4.9 (28.4 to 39.7) |
0,029 |
BMI: Body Mass Index.
Table 10: Relationship between baseline muscle attenuation and age, sex and BMI.
| Baseline BMI (kg/m2) |
Overall Cohort (n=22; 100%) |
Baseline Sarcopenia (n=9/22) |
Baseline Low MA (n=6/20) |
Concomitant Sarcopenia & MA |
|---|---|---|---|---|
| <18.5 | 0(0) | 0(0) | 0(0) | 0 |
| ≥18.5 and <25 | 1(4.5) | 1(11.1) | 0(0) | 0 |
| 25–30 | 13(59) | 7(77.8) | 2(33.3) | 2 |
| >30 | 8(36.4) | 1(11.1) | 4(66.7) | 1 |
Table 11: Blood tests according to baseline Sarcopenia.
| Sarcopenia | |||
|---|---|---|---|
| NO (n=13; 59.1%) |
YES (n=9; 40.9%) |
P value | |
| Hg <12 mg/dl | 6(46.2) | 4(44.4) | 1 |
| WBC >10.000/mm3 | 0(0) | 0(0) | NA |
| Lymphocytes < 1.200/mm3 | 5(38.5) | 3(33.3) | 1 |
| Neu/Lymph >=3 | 3(23.1) | 2(22.2) | 1 |
| LDH >400 mU/ml | 5(45.5) | 0(0) | 0.101 |
| Albumin <3 g/dl | 1(8.3) | 0(0) | 1 |
Hg: Hemoglobin; WBC: White Blood Cells; Neu/Lymph: Neutrophils/ lymphocytes; LDH: Lactate Dehydrogenase.
Table 12: Objective response rate according to skeletal muscle loss.
| Skeletal Muscle Loss >5% (n=22; 100%) | |||
|---|---|---|---|
| ORR | NO (n=14; 63.6%) | YES (n=8; 36.4%) | P value |
| 0,781 | |||
| PR | 1(7.1) | 0(0) | |
| SD | 5(35.7) | 2(25) | |
| PD | 8(57.1) | 6(75) | |
ORR: Objective Response Rate; PR: Partial Response; SD: Stable Disease; PD: Progression Disease.
Table 13: Objective response rate according to weight loss.
| Weight Loss ≥8% (n=22; 100%) | |||
|---|---|---|---|
| ORR | NO (n=18; 81.8%) | YES (n=4; 18.2%) | P value | 1 |
| PR | 1(5.6) | 0(0) | |
| SD | 6(33.3) | 1(25) | |
| PD | 11(61.1) | 3(75) | |
ORR: Objective Response Rate; PR: Partial Response; SD: Stable Disease; PD: Progression Disease.
8/22(36.4%) patients reported SML >5%: 6/12(50%) patients in Regorafenib group, while only 2/10(20%) patients in TAS- 102 group (p=0.204) (Table 2). Although most patients (15/22; 68.2%) experienced muscle wasting of any size (-3.2%±5.9; range: -14.13 to 10.7) at first disease reassessment, one patient receiving TAS-102 experienced a 10.7% increase in muscle mass (Figure 4). On the contrary, one patient receiving Regorafenib experienced a 14.13% loss in muscle mass, and was the same patient who discontinued Regorafenib after only two cycles of therapy due to treatment toxicities (Figure 4). SML wasn’t associated to OS (11.4 vs 10.9 months with SML >5% vs SML ≤5% respectively; HR: 0.56 95% CI: 0.18 to 1.73; p=0.307) (Figure 5) and response to treatment (p=0.781) (Table 12). Also weight loss ≥8% wasn’t associated to OS (11.1 vs 13.4 months with weigh loss ≥8% vs <8% respectively; p=0.696) (Figure 5) and response to treatment (p=1) (Table 13). Only 4/22 (18.2%) patients had weight loss ≥8, and all four of these patients had received Regorafenib as third-line therapy (p=0.096).
Discussion
Sarcopenia is a progressive and generalized skeletal muscle disorder that is associated with adverse outcomes [27]. In clinical practice, probable sarcopenia is identified by low muscle strength, but diagnosis is confirmed by documented low muscle quantity or quality; sarcopenia is severe when also low physical performance is present [27]. Computed Tomography (CT) is the gold standard for muscle mass assessment in cancer patients, because it provides practical and precise measurements of body composition [27]. This technique is also usually used for tumor diagnosis and disease reassessment during cancer therapy. The CT study of adipose tissue and lean mass at the level of the third lumbar vertebra appears to be strongly predictive of fat and lean mass of the whole body [22,23]. The standard method for assessing muscle mass is the SMI (Skeletal Muscle Index) [SMI=cross-sectional area in cm2 of all skeletal muscles at L3/ (height in m)2] [13,14,24]. Most of the studies diagnosed sarcopenia using the SMI cut-off points estimated by Prado et al. [13] on obese cancer patients: <38.5 cm2/m2 for females and <52.4 cm2/m2 for males. In our study, we used Martin’s cut offs, which are more recent than Prado’s parameters and are based on sex and BMI, so they can be used also in underweight, normal weight or overweight patients, in contrast with Prado’s values, that are specific for obese patients [14].
According to a review on CRC patients, the prevalence of sarcopenia is approximately 20-60% in these patients [24]. In our study, we found that 40.9% of patients were sarcopenic, irrespective of age and sex. 22.2% (2/9) and 33.3% (2/6) patients were ≥75 years into sarcopenia and low MA groups, respectively. In cancer patients, sarcopenia can occur earlier than in the general population, due to the combination of physiological factors, such as normal aging of the organism, with pathological factors, such as the production of inflammatory cytokines [24,28,29]. So, it’s very important investigating muscle mass in all patients, regardless the age. Moreover, Miyamoto et al. [30] found that, among patients with sarcopenia, low muscle mass had a significant negative prognostic value in patients under 65 years of age, rather than in those ≥65 years of age. In our study, only one patient had a BMI <25 kg/m2 and was of normal weight, while all other patients were overweight (13/22, 59%) or obese (8/22, 36.4%). Mean ± SD baseline BMI was high: 29.1±2.6 (26.0 to 33.6) in male patients and 30.6±6.1 (19.5 to 39.7) in female patients. Although 7/9(77.8%) sarcopenic patients were over-weight and 1/9 patient (11.1%) was obese, sarcopenic patients had lower BMI than patients without sarcopenia (27.2±3.5 vs 31.7±4.5 kg/m2; p=0.016); while patients with low MA, that indicates a high infiltration of fatty tissue into the muscle, had higher BMI than patients without low MA (34.1±4.9 vs 28.1±3.7 kg/m2; p=0.02). In our study, only three patients had concomitant baseline sarcopenia and low MA: two of them were over-weight, while one of them was obese. Martin et al. [14] found that weight loss ≥8%, low SMI, and low MA were independently negative prognostic factors in 1473 patients with lung or gastro-intestinal cancer. Patients with all three of these poor prognostic variables survived 8.4 months regardless of BMI, in contrast to patients who had none of these features, who survived 28.4 months (95% CI: 24.2 to 32.6; p<0.001). On the contrary, BMI was predictive of survival, with the heaviest patients showing the longest survival. However, obese patients without any risk factors survived 35.6 months (twice the overall median survival of 16.7 months) in contrast to obese patients with three poor prognostic variables, who survived only 8.5 months, similarly to patients with BMI <20.0 kg/m2 with three poor prognostic variables, who survived only 8.3 months. The concomitant presence of BMI >30 kg/m2 and low muscle mass is defined as Sarcopenic Obesity (SO) [13]. Prevalence of SO in advanced solid tumor patients average 9% (range 2.3%-14.6%), and one in four (24.7%, range 5.9%-39.2%) patients with BMI >30 kg/m2 is sarcopenic [31]. Several studies demonstrated that SO was associated not only with poor prognosis, but also with treatment toxicities [13,14,24,31]. This could be explained because patients with similar or identical body weight, Body Surface Area (BSA) or BMI may have a different ratio of lean and fat tissue, which are the major sites of distribution of lipophilic and non-lipophilic drugs, respectively [13,31-34] Prado et al. [32]. demonstrated that, in a study on 62 patients with stage II/III colorectal cancer receiving adjuvant therapy, BSA was not related to total body fat-free mass. A patient with high BSA and BMI could have low fat-free mass. A consequence of low fat-free mass could be a low volume of distribution of cytotoxic chemotherapy drugs and a higher incidence of overall toxicities. Lean body mass, which is mostly represented by muscle mass, might be a better parameter than BSA to normalize dose for therapy.
The 2022 WHO report on Europe [35] showed that almost 60% of European adults and 1 in 3 children (29% of boys and 27% of girls) were overweight or affected by obesity. Since the prevalence of obesity is increasing, it becomes very important to investigate the muscle quality and quantity in all patients, regardless of BMI, to better tailor drug dosage according to each patient’s body composition.
We didn’t find any association between muscle quantity (sarcopenia), quality (MA) and dynamics (SML during therapy) and OS, PFS and ORR. In the same way, neither sarcopenia nor low MA resulted related with treatment toxicities, but the only patient, who discontinued Regorafenib after only two cycles of therapy due to treatment toxicities, experienced a 14.13% loss in muscle mass. SML >5% occurred in 50% of patients receiving Regorafenib and only on 20% of patients receiving TAS-102. One patient receiving TAS-102 experienced a 10.7% increase in muscle mass. Only 4 patients reported weight loss ≥8%, and they all received Regorafenib. Patients receiving Regorafenib probably experienced greater muscle loss and weight loss than those receiving TAS-102, due to the drug’s toxicity profile, which resulted in physical inactivity and inappetence. TAS-102, in effect, caused more frequently hematological toxicities, especially neutropenia, compared to Regorafenib, which conversely caused more asthenia and hand-foot syndrome.
In the literature, there are only five studies, with different results, that evaluated the role of muscle mass in pretreated mCRC patients receiving Regorafenib or TAS-102. Only two of these five studies analyzed the SMI dynamics, comparing the two types of therapy.
In a Turkish study, Gokyer et al. [36] found that 92% of patients who reported Dose-Limiting Toxicities (DLT) during Regorafenib, defined as toxicities requiring dose reduction or drug withdrawal, had basal sarcopenia (p=0.005). Patients who experienced DLTs had median age of 65 years (range 61-71 years), whereas patients who did not experience DLTs had median age of 60 years (range 52-62 years) (p=0.07). Sarcopenia was found in 63.9% of patient. There was no significant difference in PFS and OS between sarcopenic and non-sarcopenic patients. In this study, patients were not stratified by the number of therapy lines received before starting Regorafenib and sarcopenia was diagnosed using SMI cut off values, based on previous study on Korean population (≤31 cm2/m2 for females and ≤49 cm2/m2 for males) [37].
Murachi et al. [38] found no relationship between sarcopenia and high-grade toxicities, but basal sarcopenia (44.1% of patients) was associated to poorer mOS in mCRC patients receiving Regorafenib (3.2 vs 5.3 months, p<0.031). 4/34 patients had received <3 previous treatment lines, while 30/34 had received ≥3 treatment lines before Regorafenib. The median age was 66 years in the group without sarcopenia, and 62 years in the group with sarcopenia. Sarcopenia was defined by cut-off values for Asian adults (6.36 cm2/m2 for males and 3.92 cm2/m2 for females) of PMI (Psoas Muscle Index = cross - sectional area of both psoas muscles (cm2)/ (height in m)2).
Malik et al. [25] examined the muscle mass using Prado’s SMI values at L3, in 78 pretreated mCRC patients receiving TAS- 102. 44% and 47% of patients were sarcopenic before starting treatment and at the first reassessment CT scan, respectively. 31% of patients reported SML >5% during TAS-102 therapy. Neither basal sarcopenia nor SML had a significant effect on PFS, while reduced OS was found in patients with SML >5% (HR: 2.03 (1.11-3.72), p=0.0039). Patients were not stratified by prior treatment lines and they at least completed one course of TAS- 102 therapy, but mean duration of therapy from basal CT and first reassessment CT is not clear.
The study of Huemer et al. [8] was the only one that evaluated patients receiving Regorafenib or TAS-102 only in third- line. Among 32 patients, 22(69%) and 10(31%) received Regorafenib and TAS-102 respectively. There was a trend for better performance status (96% vs. 70%) and younger age (59 vs 72 years) in patients treated with Regorafenib in third-line therapy compared to TAS-102. At first diagnosis of metastatic disease, 24% of patients were already sarcopenic, while, on the CT performed before starting the third line, 54% of patients presented sarcopenia. The one-year overall survival rate from the start of the third line was 61%, 29% and 16%, depending on whether the patients had normal muscle mass, stable sarcopenia or new onset of sarcopenia before initiating third line therapy, relative to the CT performed at first diagnosis of metastatic disease. On the contrary, SML during third line therapy was not significantly related to OS, regardless of the drug administered. A statistically significant SML was observed during Regorafenib treatment (median SMI change: -2.75 cm2/m2 [-6.3%]; p<0.0001), unlike what happened with TAS-102 therapy (-1.5 cm2/m2 [-3.5%]; p=0.575). Thirteen (41%) of 32 patients received both agents sequentially: 12 patients received TAS-102 as fourth line after Regorafenib as third line. In 11/12(92%) patients SMI decreased during third-line Regorafenib (median SMI change: -1.3 cm2/m2; range -0.2 to -6.9 cm2/m2), while in 9/12(75%) SMI increased during subsequent fourth-line treatment with TAS-102 (median change in SMI: +1.9 cm2/m2; range +0.2 to 6.5 cm2/m2).
Hacioglu et al. [9] investigated 36 patients affected by mCRC treated with Regorafenib or TAS-102 in ≥ 3rd line. Skeletal muscle area, volume, and mass (SMA, SMV, and SMM, respectively) were calculated at the L3 level on baseline and follow-up CT studies. Although at baseline SMA, SMV, and SMM were similar between the two groups of patients, a trend towards a reduction of these muscle parameters was shown on progression CT in patients treated with Regorafenib compared to those treated with TAS-102 (p=0.06). SMM changes were calculated on two any available consecutive CT scans, in contrast to most studies in the literature, where muscle dynamics was assessed between baseline CT and CT at first reassessment. SMM loss, considered significant if ≥2%, was greater with Regorafenib than with TAS-102 (p=0.001). Regorafenib was an independent predictor of muscle wasting (HR 10.0, 95% CI 1.46-68.5, p=0.01); whereas, skeletal muscle mass loss was a negative prognostic factor for overall survival (HR 2.87; 95% CI 1.07-7.42, p=0.03). Although patients who received Regorafenib had more SMM loss than those who received TAS-102, there was no difference in OS between these two drug groups. Currently, most of studies are retrospective and present conflicting results, maybe due to different methods used for muscle mass assessment, and to different patient stratification. However, in all studies, patients receiving Regorafenib experienced greater loss of muscle mass than patients receiving TAS-102. Therefore, several strategies could be chosen: to avoid prescribing Regorafenib to patients with severe sarcopenia; to integrate the treatment with a supportive therapy that increases muscle tissue or to choose TAS- 102 as the third line and then Regorafenib as the fourth line, to delay the loss of muscle mass. There is a need for prospective studies with the aim of defining the right therapy sequence. More efforts are needed to validate the diagnosis of sarcopenia, low muscle attenuation, and skeletal muscle loss, in order to improve the analysis of body composition and tailor the therapy to each patient.
Conclusion
In our study, muscle quantity, quality and dynamics didn’t influence survival, response to treatment and treatment toxicities. Basal sarcopenia was associated to lower BMI, while a low muscle attenuation, that represents fat infiltration into muscle tissue, was associated a higher BMI. SML and weight loss appeared more frequently in patients receiving Regorafenib than in those receiving TAS-102, although this wasn’t statistically significant. It’s very important to examine muscle mass in all patients, regardless sex, age and BMI, in order to improve the decision-making process regarding the therapy for each patient. The present negative results must be interpreted with caution due to the limited sample size, but represent further evidence of the feasibility and cost-effectiveness of the measurement of the muscle features by CT scan.
Declarations
Author contributions: Chiara Maddalena: conceptualization, methodology, investigation, database creation, data analysis, writing original draft; Andrea Ponsiglione: CT scan interpretation, investigation, data curation; Luigi Camera: CT scan interpretation, supervision, manuscript reviewing; Dario Bruzzese: formal analysis, writing - review and editing; Mariaro-saria D’Amato: investigation, data curation supervision; Chiara Carlomagno: conceptualization, resources, supervision, writing - review and editing.
Funding: This research did not receive any specific grant from funding agencies in the public, commercial, or not-for- profit sectors.
References
- Sung H, Ferlay J, Siegel RL, Laversanne M, Soerjomataram I, Jemal A, et al. Global Cancer Statistics 2020: GLOBOCAN Estimates of Incidence and Mortality Worldwide for 36 Cancers in 185 Countries. CA Cancer J Clin. 2021; 71: 209–49.
- Cervantes A, Adam R, Roselló S, Arnold D, Normanno N, Taïeb J, et al. Metastatic colorectal cancer: ESMO Clinical Practice Guideline for diagnosis, treatment and follow-up. Ann Oncol. 2022; 34: 10– 32.
- Carlomagno C, De Stefano A, Rosanova M, De Falco S, Attademo L, Fiore G, et al. Multiple treatment lines and prognosis in metastatic colorectal cancer patients. Cancer Metastasis Rev. 2019; 38: 307–13.
- AIOM. Linee Guida tumori del colon retto. Aiom. 2020. Available from: https://www.aiom.it/linee- guida-aiom-2020-tumori-delcolon/
- NCCN. Colon cancer. NCCN. 2021. Available from: https://www. nccn.org/professionals/physician_gls/pdf/colon.pdf
- Mayer RJ, Van Cutsem E, Falcone A, Yoshino T, Garcia-Carbonero R, Mizunuma N, et al. Randomized Trial of TAS-102 for Refractory Metastatic Colorectal Cancer. N Engl J Med. 2015; 372: 1909–19.
- Moriwaki T, Fukuoka S, Taniguchi H, Takashima A, Kumekawa Y, Kajiwara T, et al. Propensity Score Analysis of Regorafenib Versus Trifluridine/Tipiracil in Patients with Metastatic Colorectal Cancer Refractory to Standard Chemotherapy (REGOTAS): A Japanese Society for Cancer of the Colon and Rectum Multicenter Observational Study. Oncologist. 2018; 23: 7–15.
- Huemer F, Schlintl V, Hecht S, Hackl H, Melchardt T, Rinnerthaler G, et al. Regorafenib Is Associated With Increased Skeletal Muscle Loss Compared to TAS-102 in Metastatic Colorectal Cancer. Clin Colorectal Cancer. 2019; 18: 159-166.e3.
- Hacioglu MB, Kostek O, Kurt N, Kucukarda A, Gokyer A, Ustabasioglu FE, et al. Comparison of skeletal muscle mass loss in patients with metastatic colorectal cancer treated with regorafenib or TAS- 102. J BUON. 2019; 24: 2198–204.
- Rier HN, Jager A, Sleijfer S, Maier AB, Levin M. The Prevalence and Prognostic Value of Low Muscle Mass in Cancer Patients: A Review of the Literature. Oncologist. 2016; 21: 1396–409.
- Charette N, Vandeputte C, Ameye L, Bogaert C Van, Krygier J, Guiot T, et al. Prognostic value of adipose tissue and muscle mass in advanced colorectal cancer: a post hoc analysis of two non- randomized phase II trials. BMC Cancer. 2019; 19: 134.
- Shachar SS, Williams GR, Muss HB, Nishijima TF. Prognostic value of sarcopenia in adults with solid tumours: A meta-analysis and systematic review. Vol. 57, European Journal of Cancer. Elsevier Ltd; 2016: 58–67.
- Prado CM, Lieffers JR, McCargar LJ, Reiman T, Sawyer MB, Martin L, et al. Prevalence and clinical implications of sarcopenic obesity in patients with solid tumours of the respiratory and gastrointestinal tracts: a population-based study. Lancet Oncol. 2008; 9: 629–35.
- Martin L, Birdsell L, MacDonald N, Reiman T, Clandinin MT, Mc-Cargar LJ, et al. Cancer cachexia in the age of obesity: Skeletal muscle depletion is a powerful prognostic factor, independent of body mass index. J Clin Oncol. 2013; 31: 1539–47.
- Aubrey J, Esfandiari N, Baracos VE, Buteau FA, Frenette J, Putman CT, et al. Measurement of skeletal muscle radiation attenuation and basis of its biological variation. Acta Physiol. 2014; 210: 489–97.
- Kurk SA, Peeters PHM, Dorresteijn B, de Jong PA, Jourdan M, Creemers GJM, et al. Loss of skeletal muscle index and survival in patients with metastatic colorectal cancer: Secondary analysis of the phase 3 CAIRO3 trial. Cancer Med. 2020; 9: 1033–43.
- Miyamoto Y, Baba Y, Sakamoto Y, Ohuchi M, Tokunaga R, Kurashige J, et al. Negative impact of skeletal muscle loss after systemic chemotherapy in patients with unresectable colorectal cancer. PLoS One. 2015; 10: 1–12.
- Sasaki S, Oki E, Saeki H, Shimose T, Sakamoto S, Hu Q, et al. Skeletal muscle loss during systemic chemotherapy for colorectal cancer indicates treatment response: a pooled analysis of a multicenter clinical trial (KSCC 1605-A). Int J Clin Oncol. 2019; 24: 1204–13.
- Blauwhoff-Buskermolen S, Versteeg KS, De Van Der Schueren MAE, Den Braver NR, Berkhof J, Langius JAE, et al. Loss of muscle mass during chemotherapy is predictive for poor survival of patients with metastatic colorectal cancer. J Clin Oncol. 2016; 34: 1339–44.
- Grothey A, Van Cutsem E, Sobrero A, Siena S, Falcone A, Ychou M, et al. Regorafenib monotherapy for previously treated metastatic colorectal cancer (CORRECT): An international, multicentre, randomised, placebo-controlled, phase 3 trial. Lancet. 2013; 381: 303–12.
- Bekaii-Saab TS, Ou F-S, Ahn DH, Boland PM, Ciombor KK, Heying EN, et al. Regorafenib dose- optimisation in patients with refractory metastatic colorectal cancer (ReDOS): a randomised, multicentre, open-label, phase 2 study. Lancet Oncol. 2019; 20: 1070–82.
- Shen W, Punyanitya M, Wang Z, Gallagher D, St M, Albu J, et al. Total body skeletal muscle and adipose tissue volumes : estimation from a single abdominal cross-sectional image. J Appl Physiol. 2004; 10025: 2333–8.
- Mourtzakis M, Prado CMM, Lieffers JR, Reiman T, McCargar LJ, Baracos VE. A practical and precise approach to quantification of body composition in cancer patients using computed tomography images acquired during routine care. Appl Physiol Nutr Metab. 2008; 33: 997–1006.
- Vergara-Fernandez O, Trejo-Avila M, Salgado-Nesme N. Sarcopenia in patients with colorectal cancer: A comprehensive review. World J Clin Cases. 2020; 8: 1188–202.
- Malik M, Michalak M, Radecka B, Gełej M, Jackowska A, Filipczyk-Cisarż E, et al. Prognostic value of sarcopenia in metastatic colorectal cancer patients treated with trifluridine/tipiracil. J Clin Med. 2021; 10: 1–13.
- Cespedes Feliciano EM, Kroenke CH, Meyerhardt JA, Prado CM, Bradshaw PT, Kwan ML, et al. Association of Systemic Inflammation and Sarcopenia With Survival in Nonmetastatic Colorectal Cancer. JAMA Oncol. 2017; 3: e172319.
- Cruz-Jentoft AJ, Bahat G, Bauer J, Boirie Y, Bruyère O, Cederholm T, et al. Sarcopenia: Revised European consensus on definition and diagnosis. Age Ageing. 2019; 48: 16–31.
- Argilés JM, Busquets S, Felipe A, López-Soriano FJ. Molecular mechanisms involved in muscle wasting in cancer and ageing: Cachexia versus sarcopenia. Vol. 37, International Journal of Biochemistry and Cell Biology. 2005: 1084–104.
- Muscaritoli M, Lucia S, Molfino A, Cederholm T, Rossi Fanelli F. Muscle atrophy in aging and chronic diseases: is it sarcopenia or cachexia? Intern Emerg Med. 2013; 8: 553–60.
- Miyamoto Y, Baba Y, Sakamoto Y, Ohuchi M, Tokunaga R, Kurashige J, et al. Sarcopenia is a Negative Prognostic Factor After Curative Resection of Colorectal Cancer. Ann Surg Oncol. 2015; 22: 2663–8.
- Baracos VE, Arribas L. Sarcopenic obesity: Hidden muscle wasting and its impact for survival and complications of cancer therapy. Ann Oncol. 2018; 29: ii1–9.
- Prado CMM, Baracos VE, McCargar LJ, Mourtzakis M, Mulder KE, Reiman T, et al. Body composition as an independent determinant of 5-fluorouracil-based chemotherapy toxicity. Clin Cancer Res. 2007; 13: 3264–8.
- Ali R, Baracos VE, Sawyer MB, Bianchi L, Roberts S, Assenat E, et al. Lean body mass as an independent determinant of dose-limiting toxicity and neuropathy in patients with colon cancer treated with FOLFOX regimens. Cancer Med. 2016; 5: 607–16.
- Gusella M, Toso S, Ferrazzi E, Ferrari M, Padrini R. Relationships between body composition parameters and fluorouracil pharmacokinetics. Br J Clin Pharmacol. 2002; 54: 131–9.
- WHO Regional office for Europe. WHO European Regional Obesity Report. 2022; 2022: 1–220.
- Gökyer A, Küçükarda A, Köstek O, Hacıoğlu MB, Sunal BS, Demircan NC, et al. Relation between sarcopenia and dose-limiting toxicity in patients with metastatic colorectal cancer who received regorafenib. Clin Transl Oncol. 2019; 21: 1518–23.
- Yoon JK, Jang JY, An YS, Lee SJ. Skeletal muscle mass at C3 may not be a strong predictor for skeletal muscle mass at L3 in sarcopenic patients with head and neck cancer. PLoS One. 2021; 16: 1– 13.
- Murachi Y, Sakai D, Koseki J, Inagaki C, Nishida N, Yamaguchi T, et al. Impact of sarcopenia in patients with advanced or recurrent colorectal cancer treated with regorafenib. Int J Clin Oncol. 2021; 26: 409–16.