
Journal of Clinical Images and Medical Case Reports
ISSN 2766-7820
Clinical Image - Open Access, Volume 3
A rare case of pheochromocytoma in adrenal gland
D Rajitha1; Sheila Elangovan2; M Rajadurai3; Anjana Sathyanath1
1Department of Allied Health Sciences, Faculty of Life and Allied Health Sciences, Ramaiah University of Applied Sciences, Bengaluru, Karnataka, India.
2Department of Radiology and Imaging Sciences, Sri Ramachandra Institute of Higher Education and Research, Porur, Chennai-600116, Tamil Nadu, India.
3Department of Food technology, Faculty of Life and Allied Health Sciences, Ramaiah University of Applied Sciences, Bengaluru, Karnataka, India.
*Corresponding Author : D Rajitha
Department of Allied Health Sciences, Faculty of Life and Allied Health Sciences, Ramaiah University of Applied Sciences, New BEL Road, MSR Nagar, Bengaluru-560054, Karnataka, India.
Tel: 7095972247, Fax: 08045366677;
Email: rajitha.ah.ls@msruas.ac.in
Received : Jul 28, 2022
Accepted : Sep 23, 2022
Published : Sep 30, 2022
Archived : www.jcimcr.org
Copyright : © Rajitha D (2022).
Citation: Rajitha D, Elangovan S, Rajadurai M, Sathyanath A. A rare case of pheochromocytoma in adrenal gland. J Clin Images Med Case Rep. 2022; 3(9): 2081.
Description
A 37-year-old man with a history of post-cholecystectomy and a known case of supra renal cystic lesion was referred for contrast-enhanced computed tomography of abdomen, where a supra-renal, well-defined, thick-walled cystic lesion with intense peripheral enhancement on arterial phase measuring 7 × 8.2 × 7.6 cm (anteroposterior × craniocaudal × transverse; Figure 1b) was seen replacing the right adrenal gland. Fat planes were relatively well-maintained. The Hounsfield Units (HU) were calculated in the lesion in phases (plain/pre-contrast, venous, and delayed; Figure 1) by taking the average value of the overall heterogeneous enhancement of the lesion and observing the washout patterns in the pre-contrast (55 HU; Figure 1a), venous (140 HU; Figure 1c) and delayed phases (100 HU; Figure 1d) and comparing them to the standard radiological features.
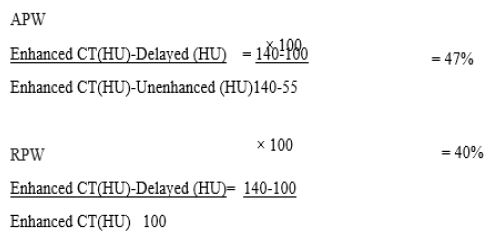
Typically, wash out patterns are calculated as follows:
APW=100 (VA-DA)/ (VA-PCA)
RPW=100 (VA-DA)/VA
(APW: Absolute Percentage Washout; RPW: Relative Percentage Washout; VA: Venous Attenuation; DA: Delayed Attenuation; PCA: Pre Contrast Attenuation)
APW >60% and RPW >40% is suggestive of adenomas and vice-versa of non-adenomas. In addition, if attenuation is < 10 HU on non-contrast imaging, it is most likely an adenoma.
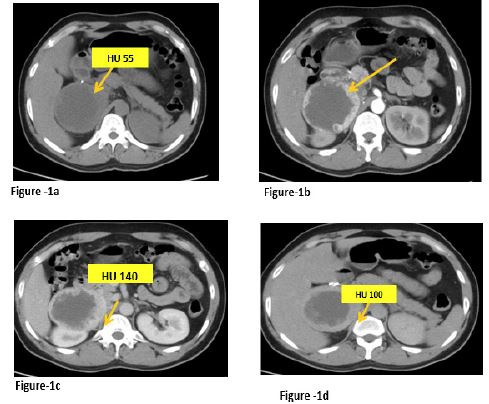
Figure 1b: Arterial phase (heterogenous enhancement of the lesion).
Figure 1c: Venous phase where the mean attenuation value is 140 HU.
Figure 1d: Delayed phase images (washout patterns) of the lesion with attenuation value of 100 HU.
To rule out the adrenal lesion described above:
The APW is < 60% and RPW is 40%, which correlates with the radiological features of unilateral, well-encapsulated solid tumour >3 cm in size, hypodensity (cystic) or hyper density (necrotic), heterogeneous enhancement (Figure 1b) due to cystic areas, all of which are suggestive of pheochromocytoma, a very aggressive and rare lesion that is difficult to detect at very early stages, which also co-relate with the histopathology of the lesion.