
Journal of Clinical Images and Medical Case Reports
ISSN 2766-7820
Research Article - Open Access, Volume 4
The distribution of curative care expenditure on gender, age
and disease system among patients with noncommunicable
diseases based on SHA 2011: A cross-sectional study in
2016-2018, Beijing
Liming Liu1#; Haiyu Xu1#; Shiqi Li1; Yurun Yang1; Yan Jiang1; Liying Zhao1; Xiaowei Man1*; Wei Cheng1,2*
1Department of Beijing University of Chinese Medicine, Beijing, China.
2Department of Shenzhen Research Institute Beijing University of Chinese Medicine, Shenzhen, China.
#Equal Contribution.
*Corresponding Author : Xiaowei Man, Wei Cheng
Department of Beijing University of Chinese Medicine No.11 North 3rd Ring Road East, Chaoyang District, Beijing, China.
Phone: +8613691055060; Tel: +8613901229820
Email: manxw@bucm.edu.cn
cwei214@vip.sina.com
Received : May 16, 2023
Accepted : Jun 05, 2023
Published : Jun 12, 2023
Archived : www.jcimcr.org
Copyright : © Man X & Cheng W (2023).
Abstract
Objectives: To analyze the distribution of curative care expenditure on gender, age and disease system of patients with Noncommunicable Diseases (NCDs) in different level of medical institutions, thus providing reference for the Hierarchical Medical System (HMS).
Setting: A multistage stratified cluster sampling survey was used for hospital sampling. System of Health Accounts 2011 (SHA2011) was used to account the Curative Care Expenditure (CCE). Multivariate analysis of variance was used to test for differences among beneficiary characteristics.The data processing and writing of this study was completed from December 2019 to May 2020 in Beijing China.
Participants: The basic data mainly include the medical records of outpatients and inpatients of 60 public hospitals in Beijing from January 1, 2016 to December 31, 2018. Patients and the public were not be involved in our study.
Outcome measures: The proportion of the CCE for NCDs in community, secondary and tertiary hospitals. The proportion of the CCE by different gender, age and system disease for NCDs in three level of hospitals.
Results: The share of CCEs of NCDs in all diseases exceeded 70%. The CCE are more consumed in tertiary hospitals, and decreased from 2016 to 2018. The change of distribution of CCE for NCDs in three level of medical institutions were similar across gender and varied by age and system diseases, but most of them are consistent with overall beneficiary characteristics.
Conclusion: HMS has been promoted with healthcare policy, and it could be further advanced through specific measures in various age and diseases.
Keywords: Curative care expenditure; Noncommunicable diseases; System of health accounts 2011; Disease system; Hierarchical medical system.
Strengths and limitations of this study
1. System of Health Accounts 2011 (SHA2011) was used to estimate the Curative Care Expenditure (CCE).
2. SHA2011 has a strong representativeness to show the overall situation of a region.
3. The distribution of CCE in institutions at all levels was calculated to reflect the situation of Hierarchical Medical System (HMS).
4. This study only represents the situation of CCE and HMS in Beijing.
Citation: Liu L, Xu H, Li S, Yang Y, Jiang Y, et al. The distribution of curative care expenditure on gender, age and disease system among patients with noncommunicable diseases based on SHA 2011: A cross-sectional study in 2016-2018, Beijing. J Clin Images Med Case Rep. 2023; 4(6): 2452.
Background
The Hierarchical Medical System (HMS) is an important policy of China’s medical reform [1]. HMS refer to grading according to the severity of the disease and the difficulty of treatment. Meanwhile, medical institutions of different levels undertake the treatment of different diseases, and gradually realize the medical process from general medicine to professional [2]. However, few researches have focused on the differences in disease populations of different levels of medical institutions. Research on HMS is often ignored.
Medical expenses are a comprehensive manifestation of the price, quantity and quality of medical services, and the flow of people with different diseases can be observed through the composition of expenses [3]. At present, the research on the cost of diseases mostly focuses on the economic burden of the disease, the influencing factors of the cost, etc., [4-6]. And most of them are carried out in one or several institutions, which cannot represent the situation of the entire region, and the representativeness of the research is relatively weak. However, SHA2011 can account for the total health expenditure of a country or a region, and the result is relatively representative [7]. At present, SHA 2011 has been applied to the calculation of the distribution of disease beneficiary characteristics [8]. The beneficiary characteristics include gender, age, disease, etc., [9]. And its advantage is that it can show the overall situation of a region, rather than small sample situation. Through SHA 2011, the cost of different levels of medical institutions in the entire region and the cost of different beneficiary characteristics can be estimated. According to the Global Burden of Disease (GBD) classification, diseases are divided into four categories, infectious diseases, Noncommunicable Diseases (NCDs), injuries and others [10]. NCDs account for the highest proportion of costs and have the greatest impact on medical institutions [11]. However, studies have shown that HMS have a poorer impact on NCDs [12]. Therefore, this article focuses on NCDs and observes treatment costs in different levels of medical institutions through SHA 2011. Compared with previous studies, the distribution status of the beneficiary characteristics of the population is more comprehensive and representative. It is helpful to understand the status of HMS for NCDs in Beijing, and to find key populations of diseases to provide reference for disease prevention and treatment. The expected hypothesis of this study is that the progress of HMS in NCDs in Beijing is different among different populations.
Material and methods
Data source
The basic data mainly include the medical records of outpatients and inpatients of 60 public hospitals in Beijing from January 1, 2016 to December 31, 2018. Demographic and cost information on patients were included in the dataset. Other data came from Beijing Health Statistics Yearbook 2017-2019, Beijing Health Finance Statistical Yearbook 2017-2019 and Beijing Health Expenses Accounting Report 2017-2019.
Sample institutions
Beijing is the capital of China. According to the different natural conditions, development environment, resource endowment, population and economic development basis and other comparative advantages and different functions undertaken by the 18 districts, Beijing is divided into four functional areas, namely, the capital functional core area, the urban functional expansion area, the urban development new area and the ecological conservation protection area. There are great differences in the distribution of medical resources and the utilization of medical services among the four functional areas in Beijing, and there are certain similarities among them. Therefore, a multistage stratified cluster sampling survey was used in Sampling of community-level hospitals, which combines stratified sampling method with cluster sampling method and multi-stage sampling method. Specificly, this paper selects the stratified sampling method to select one area from each of the four functional areas, and then carries out cluster random sampling within each area.
In the first stage, Principal Component Analysis (PCA) was used with economic indicators and the Dongcheng, Fengtai, Changping and Pinggu Districts were selected. The principal component analysis is to try to combine the original many relevant indicators (such as P indicators) into a new group of independent comprehensive indicators to replace the original indicators. The main purpose of this study is to reduce the dimension of the data space studied by using principal component analysis, and to use each principal component as a new independent variable to replace the original independent variable for regression analysis. In this stage, five indicators of financial subsidy income, number of health technicians, per capita GDP, per capita government health expenditure, and resident population density of medical institutions in each district and county were selected for principal component analysis, and two principal components were obtained.
In the second stage, streets were randomly selected at a rate of 20% of numerous streets in each district. In the third stage, 1 hospital was randomly selected in each district, and 1 community hospital was randomly selected on each street. Then, 11 Dongcheng District medical institutions, 12 Fengtai District medical institutions, 12 Changping District medical institutions and 11 Pinggu District medical institutions were selected. In addition, considering the great difference among municipal-level hospitals in Beijing, 14 municipal hospitals were included. Finally, a total of 60 medical institutions were selected.
Institutions included community (first level), secondary hospital (second level) and tertiary hospital (third level) according to the grading standard. The community is to provide health care services for residents in the community under its jurisdiction. And secondary hospitals provide comprehensive medical and health services to multiple communities. In addition, tertiary hospitals provide high-level, specialized medical and health services nationwide to solve intractable diseases [10-13].
The disease system was divided by the International Classification of Disease Tenth Revision (ICD-10). According to the classification of Global Burden of Disease (GBD), all medical records of patients with noncommunicable diseases (NCDs) were extracted.
Ethics approval
This study does not involve human participants and animal subjects. And patients or the public were not involved in the design, or conduct, or reporting, or dissemination plans of our research.
Data processing
“System of Health Accounts 2011” (SHA 2011) was universally acknowledged as a method of total health expenditure accounting, which was developed by the World Health Organization. This method is suitable for cross analysis of regional health expenditure, including source, institution and service utilization [14]. SHA2011 abandons the expression of Total Health Expenditure (THE), but recommends the usage of Current Care Expenditure (CCE). Thus, only services that lead to goods consumption is included in the calculation, including medical income, basic expenditure subsidy and special subsidy for government-designated public health projects [15]. In recent years, researchers have also started to pay attention to the cost of diverse age groups or disease groups in various countries or regions. To acquire general CCE and its disaggregation by beneficiary characteristics, a top-down approach was used. In the first step, we obtained estimates from the collected primary data. In the second step, we applied the estimates derived from the first step to the general CCE which was derived from secondary data source as fore-mentioned. The underlying hypothesis of this practice is that the estimates obtained from the selected districts were representative at the municipal level.
In this study, SHA 2011 was used to calculate the curative care expenditure of outpatients and inpatients with NCDs in different levels of medical institutions in Beijing in 2016, 2017 and 2018, only the curative service dimension was calculated, and the prevention dimension was not involved. The calculation steps are detailed in these articles [8,16]. Then, parameters were gathered from the datasets of medical records, including gender, age and disease system. Finally, the distribution of CCE is apportioned according to the parameters. The proportion of the CCE for NCDs in community, secondary and tertiary hospitals. The main indicators include the proportion of the CCE by different gender, age and system disease for NCDs in three level of hospitals.
What’s more, Take the hospital as an example to elucidate how CCE came from beneficiary characteristics. Using data extracted from the HIS of sampled hospitals, it is feasible to generate percentages of outpatient or inpatient expenditure in total curative care spending on the basis of the age, residency, and the disease using primary diagnostic information. Afterwards, these percentages were applied to curative aggregate spending of hospitals which were obtained from the National Health Accounts as well as Health and Family Planning Statistical Yearbook to estimate curative (or outpatient or inpatient) expenditure by specific ages, residency or diseases in all hospitals of Beijing.
All CCE estimates were converted to US dollars ($) based on 2018 exchange rates (1 USD=6.6118 CNY).
Statistical analysis
Multivariate analysis of variance was used to test the differences of CCE ratios in different gender, age and disease system among years and levels of medical institution.
The result was reported in the form: F=“statistical value”, p. A two-sided p value< 0.05 was considered statistically significant. Statistical tests were performed using IBM SPSS Statistics version 23.0 (©Copyright IBM Corporation 1989, 2015).
Results
Basic results in CCE of NCD patients.
Table 1: Total amount of CCE for NCDs and their share of all diseases.
| Indicators | 2016 | 2017 | 2018 |
|---|---|---|---|
| CCE of NCDs (billion $) | 14.79 | 15.66 | 17.29 |
| CCE of all diseases (billion $) | 20.11 | 21.06 | 22.85 |
| Share of CCE for NCDs among all diseases (%) | 73.57 | 74.39 | 75.69 |
As shown in Table 1: the total amount of CCE for NCDs increased year by year from 2016 to 2018. It accounts for more than 70% of CCE in all diseases, and the proportion increased from 73.57% in 2016 to 75.69% in 2018.
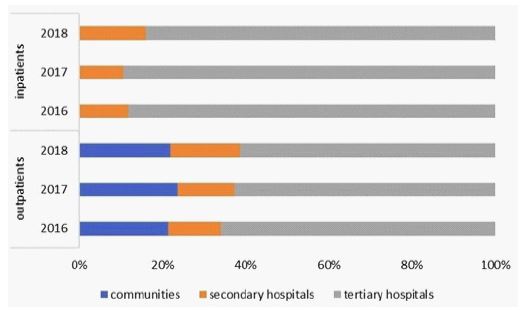
For NCD outpatients, CCE accounted for the highest proportion among tertiary hospitals, at more than 60%. And the proportion in tertiary hospitals decreased year by year from 2016 to 2018. And for NCD inpatients, the proportion of CCE in tertiary hospitals exceeded 80%, and dropped from 88.18% in 2016 to 83.78% in 2018.
For NCD outpatients, the ratio of CCE in male patients (45%) was lower than that in female patients (55%) in 2018. And for NCD inpatients, the reverse applied that the proportion of CCE in male patients (55%) was higher than female patients (45%) (Figure 2). From 2016 to 2018, the distribution of CCEs by gender remained stable in both outpatient and inpatient with NCDs. When the year is fixed, the difference in the distribution of CCE in males and females was not statistically significant in outpatients (F=4.00, p>0.05) and statistically significant in inpatients: (F=98.42, p< 0.05).
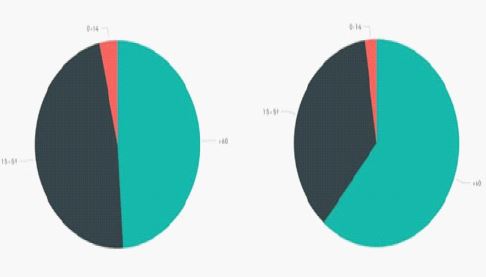
For both outpatients and inpatients with NCDs, the ratio of CCE in patients over 60 years old accounted for the highest proportion in 2018, and the proportion was higher for inpatients (60%) than outpatients (48%). Then the proportion of CCE in patients under 14 years old was the lowest apparently of less than 7% (Figure 3). From 2016 to 2018, the distribution of CCE by gender fluctuated slightly but not much in outpatient and inpatient with NCDs. When the year is fixed, the difference in the distribution of CCE in three age groups was statistically significant in both outpatients (F=604.92, p< 0.05) and inpatients: (F=173.83, p< 0.05).
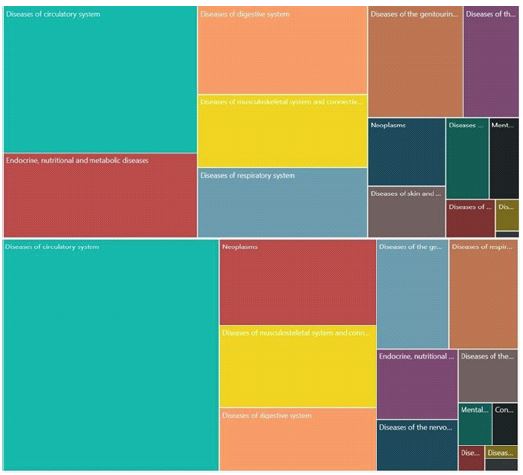
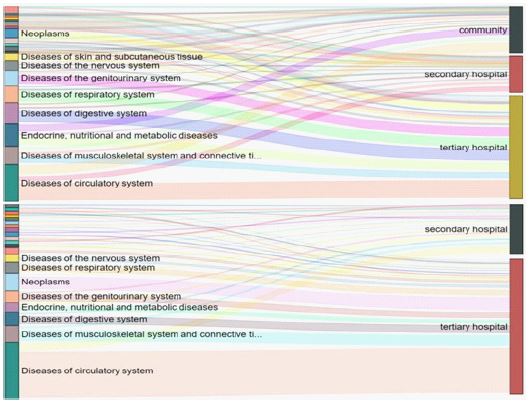
For NCD outpatient, CCE of circulatory system diseases accounted for the highest proportion about 30% in 2016-2018. Then, CCE of endocrine, nutrition and metabolic diseases accounted for the second largest ratio about 13%. And for NCD inpatients, the top three proportions of CCE continued to be in diseases of circulatory system (25%), tumor (10%), and diseases of musculoskeletal system and connective tissue (6%) during 2016-2018 (Figure 4). When the year is fixed, the difference in the distribution of CCE in disease systems was statistically significant in both outpatients (F=134.81, p< 0.05) and inpatients: (F=197.27, p< 0.05).
For both outpatients and inpatients, the CCE of both male and female patients with NCDs were mainly attributed to tertiary hospitals, while the ratio of inpatients (60%) was higher than that of outpatients (80%). For outpatients and inpatients, the proportion of CCE in tertiary hospitals decreased in both male and female from 2016 to 2018 (Figure 5). When gender was fixed, the difference in the distribution of CCE in three levels of institutions was statistically significant in 2018 (outpatients: F=3702.78, p< 0.05; inpatients: F=856.65, p< 0.05).

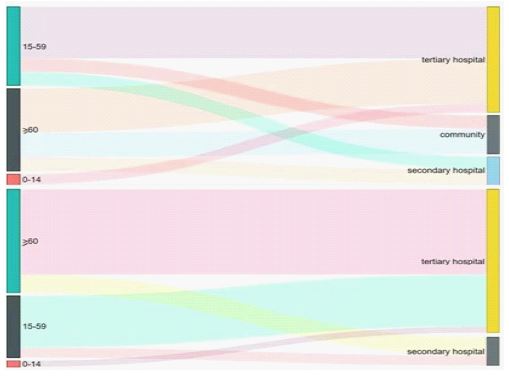
For both outpatients and inpatients, the CCE of all age groups were mainly attributed to tertiary hospitals. And the highest proportion of CCE in tertiary hospitals was NCDs for 0-14 years old, and the lowest for those over 60 years old. From 2016 to 2018, the CCE attributed to tertiary hospitals of outpatients aged 0-14 decreased. And the ratio of CCE in tertiary hospitals for inpatients over 60 years old increased. (Supplemental Figure 1) When the age group was fixed, the difference in the distribution of CCE in three levels of institutions was statistically significant in outpatients (F=9.16, p< 0.05) and not statistically significant in inpatients (F=4.70, p>0.05) in 2018.
For NCD outpatients, CCE accounted for the highest ratio in tertiary hospitals for most disease systems. The ratio of CCE in tertiary hospitals for most disease systems declined from 2016 to 2018, such as diseases of skin and subcutaneous tissue (decrease by 12 percentage points) and diseases of respiratory system (decrease by 11 percentage points). While the ratio of CCE in tertiary hospitals for some disease systems increased, such as diseases of the blood and blood-forming organs and certain disorders involving the immune mechanism (blood diseases) (increase by 15 percentage points). When the disease system was fixed, the difference in the distribution of CCE in three levels of institutions was statistically significant in 2018 (F=55.16, p< 0.05).
And for NCD inpatients, CCE accounted for the highest ratio in tertiary hospitals among all disease systems. The ratio of CCE in tertiary hospitals also declined in most disease systems from 2016 to 2018, like diseases of skin and subcutaneous tissue (decrease by 13 percentage points). Besides, in a few disease systems the ratio of CCE in tertiary hospitals increased, like diseases of the genitourinary system (increase by 4 percentage points) (Supplemental Figure 2). When the disease system was fixed, the difference in the distribution of CCE in three levels of institutions was statistically significant in 2018 (F=205.23, p< 0.05).

Discussion
From our results, CCE of NCDs shares 70% of all diseases, which reminds us NCDs are the main object of HMS. The results also showed that the CCE of tertiary hospitals is higher than that of community hospitals, and the CCE of secondary hospitals is lower than that of community hospitals. The ideal state of HMS is that patients with minor illnesses go to community hospitals, patients with serious illnesses go to large hospitals, and recovered patients go to community hospitals [17,18]. However, the medical resources of the tertiary hospitals in Beijing are very rich, leading to the fact that patients are mostly concentrated on tertiary hospitals. This is the “siphon” phenomenon in tertiary hospitals [19]. Previous study said the Beijing public hospital reform has successfully managed to redirect the flow of outpatients from tertiary hospitals to community health centres [20], and the HMS have been promoted to some extent. Our results also confirm this point, that is, the proportion of CCE in tertiary hospitals decreased from 2016 to 2018. The medical consortium is an important measure for the establishment of HMS. The medical consortium consists of a tertiary hospital, combined with secondary hospitals and community hospitals within a certain area [21]. The purpose is to guide patients with a clear diagnosis and stable condition to transfer from high-level hospitals to low-level hospitals, promote the integration of medical resources, and reverse the “siphon phenomenon”. Therefore, the construction of medical consortium should continue to be strengthened in the process of promoting HMS in the future.
From the perspective of the population distribution of NCDs patient expenses, the proportion of female patients’ expenses is higher than that of male patients especially in hospitalized patients, which is statistically significant. According to a study by the Chinese Center for Disease Control and Prevention (CDC) [22], the prevalence of most NCDs in China is higher in women than in men (except for chronic obstructive pulmonary disease and stroke), and the prevalence tends to increase from age, which is related to the results of this article. It can be inferred that because the prevalence of female with NCDs is higher than that of males, the cost of female with NCDs is also higher than that of males. Thus, screening for chronic diseases to which women are predisposed can be enhanced. The results show that the health service requirement of females should always deserve more attention. The gender difference in CCE also indicates that policy makers should strengthen the health education of males so as to focus on the early prevention of diseases. The results also show that the proportion of expenses for patients over 60 years old is higher than that for patients aged 15-59 years. In fact, the older the patients, the higher the prevalence. Therefore, older patients tend to have higher cost of NCDs. Therefore, people over the age of 60 should be paid more attention. Furthermore, as China’s aging process continues accelerating, it is predictable that a greater proportion of the elderly population will consume more medical resources in the near future. Therefore, it is needful to take a series of measures to prevent the excessive raise of treatment costs for elderly patients, which is also a critical factor to preventing the excessive consumption of medical and health resources in Beijing. In addition, the proportion of CCE in each disease system varies significantly, among which CCE of circulatory system diseases shares the highest in all diseases. It is well known that circulatory system diseases mainly include heart and blood vessel diseases. Studies have shown that between 1990 and 2017, stroke and ischemic heart disease replaced lower respiratory tract infections and neonatal diseases, becoming the main causes of death and DALYs [23] Both stroke and ischemic heart disease are circulatory diseases. It seems to indicate that the CCE of circulatory system diseases is the same as its disease burden, which is relatively high. So, diseases with a high proportion of CCE like circulatory system disease should be fully considered by the government. The results also show that policy makers should focus far more on the preventive function of community hospitals and invest more in the field of chronic non-infectious disease such as circulatory system diseases prevention and management to better control the growth of CCE by decreasing the incidence of disease.
Judging from gender, CCE in both male and female accounted for a higher proportion in tertiary hospitals significantly. This result is consistent with the overall results regardless of gender, with little change over the three years. It can be concluded that the status of HMS is not much different to male and female patients with NCDs.
From the perspective of age, CCE of different age groups occurred more in tertiary hospitals especially in outpatients, which is statistically significant. And the distribution is consistent with the overall situation in all age. From our result, CCE for children under the age of 14 occurred more in tertiary hospitals. On the one hand, illness in young children is usually caused by infectious viruses and bacteria rather than NCDs [24]. Therefore, it seems reasonable for children to consume more CCE in tertiary hospitals. On the other hand, there is a shortage of pediatricians in China. According to statistics, in areas with abundant pediatrician resources, more than half of the pediatric workload is concentrated in tertiary hospitals [25]. So this reminds us that there may be insufficient pediatricians or general practitioners in secondary hospitals and community hospitals, which also contributes to the lower proportion of CCE compared with tertiary hospitals. Therefore, attention should be paid to the training of general practitioners, and the attraction of primary medical institutions to talents should be strengthened. It is also worth noting that the proportion of CCE in tertiary hospitals for NCDs over 60 years old seems to be different from other age groups, which increased from 2016 to 2018. This suggests that the advancement of HMS is more difficult in the elderly.
As to disease systems, CCE in tertiary hospitals contributed the most for most disease systems, with significant variation in level of institutions. And the CCE ratio in tertiary hospitals decreased, which is roughly consistent with the overall results of the distribution of hospitals for all NCDs. This is a good sign that the HMS in most disease systems is progressing well. However, we noticed that the ratio of CCE in tertiary hospitals increased in few disease systems, such as outpatients with blood diseases and inpatients with genitourinary system diseases. On the one hand, it is related to the severity of different system of diseases. On the other hand, it reminds us that HMS still has room for improvement in NCDs of some disease systems. That is, most of the CCE of the various disease systems occurs to the tertiary hospitals, and a small part occurs to the community hospitals and the secondary hospitals.
Limitations
However, the findings of this study have to be seen in light of some limitations. First, this study only represents the situation in Beijing, since the situation of medical services in China varies widely across regions. Therefore, the application of SHA2011 in various regions should be enriched in the future. Second, SHA2011 divides the age group into 20 groups. However, actually some age groups have very few cases, which will affect the accuracy of the results. Thus, we combined the age groups into 3 groups, which made the results more stable. In the future, the grouping should be refined and the whole life cycle research should be strengthened.
Conclusion
In this research, we observed the CCE of patients with NCDs in different levels of hospitals and finds that the CCE are more consumed in tertiary hospitals, but decreased from 2016 to 2018. In addition, comparing the status of HMS in different characteristics of the population during three consecutive years, we found that the change of distribution of CCE for NCDs in three level of medical institutions were similar across gender and varied by age and system diseases, but most of them are consistent with the overall distribution of hospitals. In summary, this article suggested that the promotion of HMS needs to be further promoted through specific measures in various age and diseases, such as regarding circulatory system disease as a key disease, establishing special programs for disease prevention, setting better health care policies such as medical insurance and drug purchase should be set up for NCDs over the age of 60. At the same time, medical institutions should clarify their own positioning and actively promote the construction of HMS.
Declarations
Funding: The fund is sourced from 2020 Beijing Municipal Health Total Cost Accounting Research, and the fund project only provides basic data support for this study.
Conflict of interest: No conflict of interest exits in the submission of this manuscript, and manuscript is approved by all authors for publication. I would like to declare on behalf of my co-authors that the work described was original research that has not been published previously, and not under consideration for publication elsewhere, in whole or in part. All the authors listed have approved the manuscript that is enclosed.
Authors’ contributions: Conceived and designed the experiments: Wei Cheng, Xiaowei Man.
Performed the experiments: Xiaowei Man, Yan Jiang, Liying Zhao, Liming Liu.
Analyzed the data: Liming Liu, Shiqi Li.
Contributed reagents/materials/analysis tools: Liming Liu, Haiyu Xu.
Wrote the paper: Liming Liu, Haiyu Xu, Yurun Yang.
References
- Xiaojun L, Zhaoxun H, Samuel TD, Meikun H, Anran T, et al. Knowledge, attitudes, and practices related to the establishment of the National Hierarchical Medical System (NHMS) among outpatients in Chinese tertiary hospitals. Medicine. 2018; 97.
- Shen X, Yang W, Sun S. Analysis of the Impact of China’s Hierarchical Medical System and Online Appointment Diagnosis System on the Sustainable Development of Public Health: A Case Study of Shanghai. Sustainability. 2019; 11: 6564.
- Yalan Z, Chunping L, Luwen Z, et al. How to control the economic burden of treating cardio-cerebrovascular diseases in China? Assessment based on System of Health Accounts 2011. Journal of global health. 2020; 10.
- Shuang Z, Jing O, Meizhen Z, et al. Factors associated with child delivery expenditure during the transition to the national implementation of the two-child policy in China. Health and quality of life outcomes. 2021; 19.
- The cost of Occupational Disease: A Literature Review. Revista Facultad Nacional de Salud Pública. 2015; 33.
- Angelis A, Tordrup D, Kanavos P. Socio-economic burden of rare diseases: A systematic review of cost of illness evidence. Health policy. 2015; 119.
- Nila N, Ilker D, Awad M. Developing health accounts following SHA 2011: A situational analysis of countries in WHO Eastern Mediterranean Region. Eastern Mediterranean health journal=La revue de sante de la Mediterranee orientale=al-Majallah al-sihhiyah li-sharq al-mutawassit. 2020; 26.
- Honghong F, Kai P, Xiaoju L, Liwen Z, Lu M, et al. Case study of the beneficiary group distribution of curative care expenditure based on SHA 2011 in Xinjiang autonomous region, China. BMJ open. 2021; 11.
- Duan W, Zheng A, Mu X, Li M, Liu C, et al. How great is the medical burden of disease on the aged? Research based on “System of Health Account 2011”. Health and Quality of Life Outcomes. 2017; 15.
- Misganaw A, Haregu TN, Deribe K, Tessema GA, Deribew A, et al. National mortality burden due to communicable, non-communicable, and other diseases in Ethiopia, 1990-2015: Findings from the Global Burden of Disease Study 2015. Population Health Metrics. 2017; 15.
- E BD, Simiao C, Michael K, Mark EMG, Les O, et al. The economic burden of chronic diseases: Estimates and projections for China, Japan, and South Korea. The Journal of the Economics of Ageing. 2020; 17.
- Zhongliang Z, Yaxin Z, Chi S, Sha L, Rashed N, et al. Evaluating the effect of hierarchical medical system on health seeking behavior: A difference-in-differences analysis in China. Social Science & Medicine. 2021; 268.
- Shangren Q, Ye D. Who is willing to participate in and provide Family Doctor Contract Service?: A cross-sectional study based on the medical staff’s perspective in China. Medicine. 2021; 100.
- OCDE, Eurostat, OMS. A System of Health Accounts 2011: Revised edition: OECD Publishing; Éditions OCDE.
- Li M, Zheng A, Duan W, Mu X, Liu C, et al. How to apply SHA 2011 at a subnational level in China’s practical situation: take children health expenditure as an example. Journal of Global Health. 2018; 8.
- Junlin H, Zhuo Y, Wenjuan D, Yushan W, Xin W. Factors of hospitalization expenditure of the genitourinary system diseases in the aged based on “System of Health Account 2011” and neural network model. Journal of global health. 2018; 8.
- Yu X, XiaoHong W, Jia C, Fang-Fei X. Challenges in establishing a graded diagnosis and treatment system in China. Family practice. 2021.
- Functional Positioning of City-level Top Three Hospitals based on Grading Diagnosis and Treatment; 2018; Chongqing, China.
- Yuqian C, Linan W, Xin C, Jiajie X, Yingqi X, et al. COVID-19 as an opportunity to reveal the impact of Large hospital expansion on the healthcare delivery system: evidence from Shanghai, China. Annals of translational medicine. 2021; 9.
- Liu X, Xu J, Yuan B, Ma X, Fang H, et al. Containing medical expenditure: lessons from reform of Beijing public hospitals. BMJ. 2019; 365: l2369.
- Qinde W, Xianyu X, Wenbin L, Yong W. Implementation efficiency of the hierarchical diagnosis and treatment system in China: A case study of primary medical and health institutions in Fujian province. The International journal of health planning and management. 2021.
- Limin W, Zhihua C, Mei Z, Zhenping Z, Zhengjing H, Xiao Z, et al. Study on the Prevalence and Burden of Chronic Diseases in the Chinese Elderly Population. Chinese Journal of Epidemiology. 2019; 277-283.
- Zhou M, Wang H, Zeng X, Peng Y, Jun Z, et al. Mortality, morbidity, and risk factors in China and its provinces, 1990-2017: A systematic analysis for the Global Burden of Disease Study 2017. The Lancet. 2019; 394.
- T BM. Infectious disease in pediatric out-of-home childcare. American journal of infection control. 2005; 33.
- Yongjun Z, Lisu H, Xin Z, Zhang X, Ke Z, et al. Characteristics and Workload of Pediatricians in China. Pediatrics. 2019; 144.