
Journal of Clinical Images and Medical Case Reports
ISSN 2766-7820
Research Article - Open Access, Volume 4
Insulin therapy combined or not with metformin is associated
to a reduced bone mineral density and content in type 2
diabetic postmenopausal women
Rim Cherif1*; Feten Mahjoub2; Hela Sahli3; Elhem Cheour3; Mohsen Sakly1; Khemais Ben Rhouma1; Nebil Attia1
1LR17ES02, Research Unit ’Integrated Physiology, Laboratory of Biochemistry-Human Nutrition, Faculty of Sciences of Bizerte, Carthage University, Tunis, Tunisia.
2Department of Diabetology, National Institute of Nutrition, Tunis, Tunisia.
3Immuno-Rheumatology Laboratory, Rabta Hospital, Faculty of Medicine of Tunis, Tunis El Manar University, Tunis, Tunisia.
*Corresponding Author : Rim Cherif
LR17ES02 Integrated Physiology, Laboratory of Biochemistry and Human Nutrition, Faculty of Sciences of Bizerte, 7021 Jarzouna, Carthage University, Tunisia.
Tel: +216 22 73 55 38;
Email: cherifrim17@yahoo.fr
Received : May 08, 2023
Accepted : Jun 06, 2023
Published : Jun 13, 2023
Archived : www.jcimcr.org
Copyright : © Cherif R (2023).
Abstract
Anti-diabetic drugs may have negative, positive or neutral effect on bone health. The aim of this study was to compare the effect of combined treatment of metformin and insulin, metformin monotherapy and insulin monotherapy on Bone Mineral Density (BMD), Bone Mineral Content (BMC) and bone markers in postmenopausal women. In this cross-sectional study, a total of 81 postmenopausal women aged 50 years or older were recruited. Twenty women were on metformin monotherapy (M,n=20), 28 on metformin and insulin therapy (M+I, n=28), and 25 women on insulin monotherapy. Only 8 women were without treatments of diabetes (WT, n=8). Biochemical analysis was obtained and BMD, BMC, lean and fat mass in different sites were measured by dual-energy X-ray absorptiometry scanning. The results show a significantly higher femoral neck BMD value in women on met formin combined to insulin therapy compared to women on insulin mono therapy after adjustment for all possible covariates. In addition, we observed a higher BMC at the trunk level in women taking metformin drugs compared to those taking insulin combined with metformin treatment, and women on insulin monotherapy after adjustment. However, there is no significant difference in bone markers concentrations between groups. We hypothesized that only insulin monotherapy is associated to a reduced bone mineral density and content in type 2 diabetic postmenopausal women. Also, our findings suggest a favorable and positive effect of metformin on bone mineral density and content.
Keywords: Bone mineral density; Bone mineral content; Bone markers; Metformin; Insulin; Postmenopausal women.
Citation: Cherif R, Mahjoub F, Sahli H, Cheour E, Sakly M, et al. Insulin therapy combined or not with metformin is associated to a reduced bone mineral density and content in type 2 diabetic postmenopausal women. J Clin Images Med Case Rep. 2023; 4(6): 2453.
Introduction
Bone Mineral Density (BMD) has been widely accepted as the main measure for the diagnostic of osteopenia and osteoporosis [1]. Osteoporosis is a disease marked by bone loss and significant bone fragility leading to an increased risk of fracture [2]. Age-related osteoporosis is four times more common in women due to postmenopausal hormone deprivation [3]. It is defined by a BMD which is reduced compared to normal levels. The reduction of bone densitometry with a T-score of ≤ -2.5 was based on the definition of the World Health Organization. Low BMD is a major risk factor for osteoporosis and fracture [4].
Type 2 Diabetes Mellitus (T2DM) is a disease closely linked to aging, and its prevalence increases markedly in postmenopausal women [5]. While T2DM and osteoporosis have been traditionally viewed as separate entities, accumulating evidence indicates that these diseases are linked. Indeed, growing body of epidemiological studies has suggested that diabetes mellitus and risk of fall or fractures are common among the older and postmenopausal subjects [6,7].
Mechanisms underlying the deleterious effects of diabetes on bone health are partially known. However documented results from previous studies suggest that increased bone fragility in these patients is likely to be related to impaired bone strength, possibly caused by increased porosity of cortical bone [8] and compromised bone material strength [9]. This detrimental effect of diabetes on bone might be multi-factorial such as hyperglycemia [10] and abnormal parathyroid hormone homeostasis [11].
Another variable that could play a key role in bone metabolism and fracture risk is the drug regimen used to treat T2DM. Indeed, Anti-diabetic medication are often prescribed for glucose control level in diabetic patients. However, studies on the relationship between anti-diabetic drugs and bone health convey conflicting finding [12,13]. For example, several studies have reported an increase in the number of fractures among patients with T2DM who were treated with insulin [14,6]. In contrast, studies have reported a positive relationship between BMD and insulin therapy in patient with diabetes mellitus [15] and an increase in bone formation and reduction of bone resorption in adult mice after injection of insulin [16].
Moreover, metformin is an oral anti-diabetic drug accepted as first line therapy in the treatment of T2DM. Clinical and preclinical data suggest a positive [12] or neutral [17] effect of metformin on BMD, fracture risk and bone metabolism.
Hence, clinical and epidemiological studies are conflicted regarding the effect of anti-diabetic drugs on bone. Therefore, a better understanding of the impact of various classes of diabetes medication and their combination on bone is essential to aid clinicians in informed decision-making for judicious use of different medications of diabetes mellitus when associated to osteoporosis.
Since the comparison of the effect of combined treatment of metformin and insulin, metformin monotherapy and insulin injection on BMD, Bone Mineral Content (BMC) and bone markers has not been assessed simultaneously in clinical research, we aimed to investigate the impact of these different forms of anti-diabetic therapy on bone profiles in postmenopausal women with T2DM.
Patients and methods
Patients
In this cross-sectional study, 101 Tunisian postmenopausal women were initially recruited but 20 patients left the study for socio-economic reason. The 81 postmenopausal women (age range: 50-83 years) involved in this study were recruited for a period of 1 years, during their visits for routine examinations, from the endocrinology department of the National Institute of Nutrition and Food Technology of Tunis, Tunisia.
Women admitted to this study must be at least 50 years of age, postmenopausal (cessation of menstruation for at least 1 year), with or without type 2 diabetes mellitus and previously undiagnosed for osteoporosis or osteoporotic fracture. None of the patients had any of the following disorders: liver or renal disease, endocrinopathy such as hyperthyroidism, hyperparathyroidism, chronic inflammatory rheumatism, early menopause before the age of 40, previous pathological fracture and multiple fractures in childhood. All subjects were free of drugs knowns to influence bone metabolism, including: bisphosphonate, or estrogen replacement therapy, corticosteroids, thyroid hormone, thiazide diuretic, heparin, barbiturates, calcitonin, vitamin D supplement and calcium.
In this population, we have distinguished 4 groups: women on metformin monotherapy (M, n= 20), women on metformin and insulin therapy (M+I, n=28), women on insulin monotherapy (I, n=25), and a group of women without treatments of diabetes (WT, n=8).
A standardized questionnaire was used to collect information such as age, age at the onset of menopause, duration of diabetes, education, occupation, family history of osteoporosis, history of peripheral traumatic fractures, weight history, smoking habits, level of physical activity, and current medication use.
The study has received ethics approval from the local ethics committee of the National Institute of Nutrition and Food Technology of Tunis and all participants signed informed consent documents before the study. The consent includes the agreement of patients to participate in the clinical study and to undergo free densitometry examination.
Anthropometric parameters
Each participant was weighed by a scale with a precision of 100 g after keeping only her underwear. Height was determined to the nearest cm in a standing position. Waist circumference was measured at the narrowest part of the abdomen, that is, at the natural indentation between the 10th rib and the iliac crest (minimum size). The Body Mass Index (BMI) of each patient was calculated as the weight (kg) divided by the square of height (m2).
Hypertension was diagnosed according to predetermined blood pressure level (systolic blood pressure >130 mmHg and/or diastolic blood pressure level >85 mmHg) [18] or the patients were on antihypertensive therapy.
Biochemical analysis
Blood samples were taken from antecubital vein, in subjects who had fasted for at least 12 hours, and placed into heparinized or non-heparinized tubes. Tubes were centrifuged at 3000 × g for 10 min. The sample was taken at a fixed time in the morning between 07:30 and 08:30.
The parameters of carbohydrate (glycemia and glycated hemoglobin [HbA1c]), lipid (total cholesterol, triglycerides, high density lipoprotein cholesterol [HDL-cholesterol]), hepatictransaminases (Alanine Aminotransferase [ALAT], Aspartate Aminotransferase [ASAT], Gamma Glutamyl-Transferase [GGT], and Total Alkaline Phosphatases [PAL]), Renal (Creatinine) and calcium and phosphorus levels were determined by well-validated laboratory routine methods. Serum low density lipoprotein cholesterol (LDL-cholesterol) values was estimated using the Friedewald formula [19].
Fasting blood samples were also collected in non-heparinized tube for the serum insulin concentration, bone resorption marker (C-Terminal Telopeptide Of Type I Collagen [CTX-I]) and bone formation marker measurements (N-Terminal Propeptide Of Procollagen Type I [P1NP]). The tube was left for 30 min at room temperature (to allow clot formation) then centrifuged at 1000 × g for 15 min. The serum was separated and stored in microtubes of 250 μl at 80°C until the day of manipulation.
After adequate thawing, the insulin assay was carried out by the ELISA method (Enzyme-linked immunosorbent assay) via a commercial kit (ALPCO, salem, USA). Bone markers concentration was performed by “IDS-iSYS Multi-Discipline Automated” automaton with a commercial kit for CTX-I (IDS-iSYS CTX-I, crossLaps) and P1NP (IDS-iSYS Intact PINP).
Dual-energy X-ray Absorptiometry (DXA) measurements
BMD, BMC, and body composition were measured by DXA using GE-Lunar PRODIGYTM device (GE Healthcare, Madison, USA) calibrated daily using a standard phantom supplied by the manufacturer. BMD was measured in the lumbar vertebrae (anteroposterior projection at L1-L4), right and left femur, right and left femoral neck, hip total and whole body and the results were expressed in g/cm2. DXA also allowed us to evaluate the body composition and the BMC of each subject from the measurement of the whole body. The BMC is a measurement of bone mineral found in a specific area. Thus, we quantified lean mass (kg), body fat (kg and %) and BMC (g) at legs, trunk and the whole body.
Statistical analysis
The values of the continuous variables are expressed in mean ± SD, the nominal variable is expressed in number of individuals and in percentage. The Chi-square test was used to examine difference between groups for hypertension. For continuous variables, the comparison between the four groups was carried out by a one-way analysis of variance (one-way ANOVA) followed by a Fisher LSD test to locate the differences between the groups. A covariance analysis (ANCOVA) was used to adjust for covariates that could influence the bone profile according to the specifications of the STROBE statement [20]. In all cases, the level of statistical significance was set at p< 0.05. All statistics were performed using the Stat View package (Version 5, SAS Institute, Inc., Cary, NC).
Results
The anthropometric and clinical parameters of women with metformin drugs (M, n = 20), metformin drugs and insulin injection (M+I, n = 28), insulin injection (I, n = 25), and women without anti-diabetic treatment (WT, n = 8) are shown in Table 1.
The age of women under injection of insulinis significantly higher than women without anti-diabetic treatments (60.48 ± 6.34 vs 54.75 ± 2.55 years respectively, p < 0.05). However, the 4 groups of women are matched for the number of years of menopause.
Women without anti-diabetic treatment are more likely to be obese (89.08 ± 18.10 vs 75.75 ± 10.20 kg, p < 0.05) and had significantly higher BMI (38.01 ± 9.42 vs 30.38 ± 3.79 kg/m2, p< 0.001) than women on metformin drugs. The height and waist circumference were not significantly different between groups.
The highest fasting glucose concentration and HbA1c values were found in women on metformincombined to insulin (12.35 ± 3.97 mmol/l and 9.64 ± 1.71% respectively). These values are significantly higher than the M and WT groups. Compared to the women on metformin drugs, women under insulin injection showed significant higher insulin concentration (5.02 ± 2.33 vs 12.33 ± 16.17 μlU/ml respectively, p < 0. 05).
For lipid profile, the M group have highest and significantly different value of triglycerides compared to the insulin monotherapy and WT groups (2.07 ± 1.33 vs 1.49 ± 0.84 mmol/l and 2.07 ± 1.33 vs 1.31 ± 0.21 mmol/l respectively, p < 0.05), whereas, total cholesterol, HDL-cholesterol, and LDL-cholesterol showed no significant changes.
However, at the phospho-calcic profile, phosphorus concentration was different between women with metformin combined to insulin and women without treatment (1.15 ± 0.14 vs 1.03 ± 0.12 mmol/l, p < 0, 05) (Table 1).
The analysis of the body composition shows a considerable difference in fat mass between the group of women taking metformin drugs and untreated women and this in the legs (11.06 ± 3.84 vs 15.55 ± 5.92 kg respectively, p < 0.01) and the whole body (34.30 ± 7.15 vs 42.80 ± 1.14kg respectively, p < 0.05).
In all measured sites, the lean mass is different between the group of women taking metformin and women receiving insulin with a higher value in the latter (Table 2).
Figure 1 shows a comparison of BMD values at all measured sites in women treated with metformin alone, metformin and insulin injection, insulin injection alone, and women without anti-diabetic treatment after adjusting for age, weight, BMI, blood glucose, HbA1c, insulin concentration, triglycerides, phosphorus, body fat and lean mass. We have observed differences in the left femoral neck BMD values between patients receiving metforminmonotherapy with insulin injection and those with insulin treatment only. Indeed, after adjusting for age, weight, BMI, blood glucose,HbA1c, insulin concentration, triglycerides, phosphorus, body fat and lean mass, results reveal that M+I group have higher BMD than insulin group (0.970 ± 0.16 vs 0.889 ± 0.13 g/cm2; p < 0.05) (Figure 1E).
In addition, we found a significant difference in the right femoral neck BMD value between women on metformin combined to insulin therapy and women on insulin therapy only with a lower BMD value in the latter. (0.969 ± 0.15 vs 0.899 ± 0.11 g/cm2, p < 0.05) (Figure 2F).
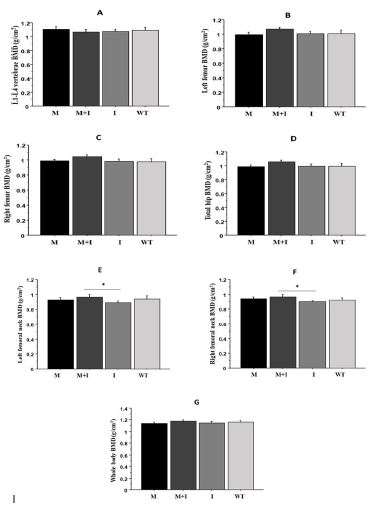
The results are expressed as mean ± SD (one-way ANOVA test followed by a Fisher LSD test adjusted by age, weight, BMI, blood glucose, HbA1c, insulin concentration, triglycerides, phosphorus, fat and lean mass). *p < 0.05 for M+I vs I. BMD: bone mineral density; M: Metformin; M+I: metformin and insulin injection; I: Insulin injection; WT: Without treatment.

The results are expressed as mean ± standard deviation (one-way ANOVA test followed by a Fisher LSD test adjusted by age, weight, BMI, blood glucose, HOMA-IR, triglycerides, phosphorus, fat mass and lean mass). ## p < 0.01 for M vs M+I; §§p < 0.01 for M vs I. CMO: bone mineral content; M: Metformin; M+I: Metformin and insulin injection; I: Insulin injection; WT: Without treatment.
Table 1: Anthropometric and clinical parameters of women with different anti-diabetic treatments.
| Variables | M (n=20) | M+I (n=28) | I (n=25) | WT (n=8) |
|---|---|---|---|---|
| Age (years) | 58.90 ± 6.60 | 57.25 ± 5.67 | 60.48 ± 6.34μ | 54.75 ± 2.55μ |
| Number of years of menopause (years) | 10.37 ± 5.63 | 10.04 ± 7.35 | 13.08 ± 7.93 | 7.50 ± 4.54 |
| Weight (kg) | 75.75 ± 10.20§ | 82.71 ± 12.83 | 82.44 ± 13.94 | 89.08 ± 18.10§ |
| Height (cm) | 157.95 ± 6.47 | 155.82 ± 4.88 | 156.72 ± 5.51 | 154.12 ± 10.12 |
| Waist circumference (cm) | 106.92 ± 14.51 | 111.27 ± 11.78 | 113.0 ± 11.27 | 111.25 ± 17.62 |
| BMI (kg/m2) | 30.38 ± 3.79*, #, §§§ | 33.94 ± 4.20*, ¤ | 33.60 ± 5.09#, μ | 38.01 ± 9.42§§§, ¤, μ |
| Hypertension | ||||
| HTA+ | 8 (40) | 20 (71,43) | 17 (68) | 2 (25) |
| HTA- | 12 (60) | 8 (28,57) | 8 (32) | 6 (75) |
| Duration of diabetes (years) | 9.63 ± 5.27 | 10.59 ± 5.70 | 11.64 ± 6.27 | - |
| Glycemia (mmol/l) | 9.88 ± 3.94*, § | 12,35 ± 3,97*, ¤¤¤ | 11.47 ± 4.39μμ | 6.55 ± 1.46§,¤¤¤, μμ |
| HbA1c (%) | 7.83 ± 1.80***, #, § | 9.64 ± 1.71***, ¤¤¤ | 9.09 ± 1.58#, μμμ | 6.07 ± 1.0§, ¤¤¤, μμμ |
| Insulin concentration (μl U/ml) | 5.02 ± 2.33# | 9.89 ± 10.30 | 12.33 ± 16.17# | 6.44 ± 3.23 |
| Total cholesterol (mmol/l) | 5.57 ± 1.77 | 4.88 ± 0.73 | 4.75 ± 1.55 | 4.98 ± 1.46 |
| HDL (mmol/l) | 1.22 ± 0.13 | 1.30 ± 0.26 | 1.18 ± 0.31 | 1.26 ± 0.54 |
| LDL (mmol/l) | 3.31 ± 1.25 | 2.91 ± 0.79 | 2.96 ± 1.03 | 3.13 ± 1.37 |
| Triglycerides (mmol/l) | 2.07 ± 1.33#, § | 1.55 ± 0.52 | 1.49 ± 0.84# | 1.31 ± 0.21§ |
| ASAT (UI/l) | 21.71 ± 8.81 | 22.85 ± 9.68 | 20.71 ± 4.08 | 19.75 ± 3.49 |
| ALAT (UI/l) | 22.29 ± 10.99 | 25.35 ± 12.95 | 21.24 ± 7.14 | 18.0 ± 2.45 |
| GGT (UI/l) | 25.50 ± 14.70 | 24.56 ± 19.49 | 23.60 ± 13.44 | 20.17 ± 2.79 |
| 20.17 ± 2.79 | 68.08 ± 16.34 | 74.29 ± 26.81 | 82.75 ± 25.92 | 61.67 ± 19.60 |
| Creatinine (μmol/l) | 58.40 ± 9.36 | 65.20 ± 13.39 | 70.55 ± 26.50 | 67.33 ± 16.17 |
| Calcium (mmol/l) | 2.27 ± 0.08 | 2.25 ± 0.10 | 2.30 ± 0.10 | 2.26 ± 0.09 |
| Phosphorus (mmol/l) | 1.08 ± 0.08 | 1.15 ± 0.14¤ | 1.14 ± 0.14 | 1.03 ± 0.12¤ |
The results of the continuous variables are expressed in mean ± SD, the nominal variable is expressed in number of individuals and in percentage in parentheses. Threshold of significance P < 0.05 (One-way test ANOVA followed by a Fisher LSD test for continuous variables and Chi 2 test for the nominal variable). Only the significant differences observed between the groups are represented by the following symbols: * M vs M + I; # M vs I; § M vs WT; ¤ M + I vs WT; μ I vs WT. * p < 0.05; ** p < 0.01; *** p < 0.001. M: metformin; M + I: metformin and insulin injection; I: Insulin injection; WT: Without treatment; BMI: Body Mass Index; HTA +: Presence of hypertension; HTA-: Absence of hypertension; HbA1c: glycated hemoglobin; HDL: High density lipoprotein; LDL: Low density lipoprotein; ALAT: Alanine aminotransferase: ASAT: Aspartate aminotransferase; GGT: Gamma glutamyl transferases.
Table 2: Body composition of women with different anti-diabetic treatments.
| Variables | M (n = 20) | M+I (n = 28) | I (n = 25) | WT (n = 8) |
|---|---|---|---|---|
| Fat mass legs (kg) | 11.06 ± 3.84§§ | 12.23 ± 3.66 | 11.63 ± 3.52 | 15.55 ± 5.91§§ |
| Fat mass trunk (kg) | 17.82 ± 3.04 | 19.83 ± 4.41 | 18.87 ± 4.17 | 19.97 ± 4.59 |
| Whole body fat mass (kg) | 34.30 ± 7.15§ | 38.28 ± 8.56 | 36.93 ± 8.23 | 42.80 ± 1.14§ |
| Fat legs (%) | 48.00 ± 7.26§ | 49.10 ± 6.71¤ | 47.11 ± 6.40 | 55.20 ± 9.17§, ¤ |
| Fat trunk (%) | 48.51 ± 3.59 | 48.92 ± 4.69 | 47.02 ± 4.60 | 50.20 ± 5.83 |
| Whole body fat (%) | 46.89 ± 4.46§ | 47.79 ± 4.50 | 46.16 ± 4.13μ | 51.02 ± 6.49§, μ |
| Lean mass legs (kg) | 11.51 ± 1.76# | 12.22 ± 1.51 | 12.68 ± 2.13# | 11.82 ± 1.58 |
| Lean mass trunk (kg) | 18.56 ± 2.63# | 20.44 ± 2.93 | 21.03 ± 3.93# | 19.86 ± 5.43 |
| Whole body lean mass (kg) | 38.28 ± 3.80# | 41.24 ± 4.85 | 42.50 ± 6.81# | 40.31 ± 7.84 |
The results are expressed as mean ± SD. Threshold of significance p < 0.05 (One-way test ANOVA followed by Fisher LSD test). Only the significant differences observed between the groups are represented by the following symbols: §p < 0.05; §§p < 0.01. #: M vs I; §: M vsWT; ¤: M + I vs WT.M: metformin; M + I: metformin and insulin injection; I: Insulin injection; WT: Without treatment.
Next, we compared the BMC at different measurement sites (legs, trunk, and whole body) in the 4 groups of women undergoing different anti-diabetic treatments, after adjusting for age, weight, BMI, blood glucose, HbA1c, insulin concentration, triglycerides, phosphorus, fat mass and lean mass.
The results obtained reveal a higher trunk BMC in the group of women taking oral metformin alone compared to those taking met formincombined to insulin injection (674 ± 127.52 vs 570.96 ± 160.58 g, p < 0.01) (Figure 2B). The same difference in the trunk BMC was observed between women on metformin drugs only and those on injection of insulin with higher BMC in the metformin group (674 ± 127.52 vs 547.08 ± 157.89 g, p < 0.01) (Figure 2B).
CTX-I and PINP concentrations was not significantly different betweengroups (Data not shown).
Discussion
This is the first study to compare the effect of different forms of diabetes therapy: metformin monotherapy, metformin combined with insulin injections and insulin monotherapy on the BMD, BMC, and bone remodeling markers simultaneously in diabetic postmenopausal women.
To characterize the different groups of women, we have also undertaken a detailed analysis of the different anthropometric, clinical, biochemical parameters and analyzes of the body composition. These analyzes show that the groups differ in age, weight, BMI, carbohydrate balance, triglycerides and phosphorus. Regarding body composition, these groups are not matched for body fat and lean mass. Previously, it has been demonstrated that bone profiles can be positively or negatively influenced by these parameters. Indeed, several studies have noted the effects of age [2], weight and related parameters [2,21], carbohydrate parameters [22], lipid parameters [23], phosphorus [24], body fatand lean mass [25] on BMD. Thus, to rule out the influence of these variables on the BMD, BMC and bone markers measurements, we have considered these variables as confounding factors.
Then, after adjustment for age, weight, BMI, blood glucose, HbA1c, insulin concentration triglycerides, phosphorus, body fat and lean body mass, the results of this cross-sectional study show significantly higher BMD in the left and right femoral neck in patients treated with combined metformin and insulin compared to patients undergoing insulin injection only. Another interesting finding of our study is that trunk BMC was higher in women taking metformin drug compared to women taking metformin combined with insulin injections and women receiving insulin alone after adjusting with confounding factors. Nevertheless, BMC of legs and whole body was statistically not different between women groups. On the other hand, we observed higher bone marker concentrations in non-diabetic women, but these results remain statistically insignificant.
Based on these results, we hypothesized that the combination of metformin with insulin or metformin drug alone may be less harmful to femoral neck BMD than insulin injection monotherapy. Also, we suggested that the trunkBMCmay be less affected when the subject is treated with metformin drug compared to other types of treatments.
In this study, all patients on oral anti-diabetic drugs are treated with metformin. It is an anti-diabetic treatment that belongs to biguanide class and used as first-line agent for the treatment of types 2 diabetes [2].
Metformin acts through numerous mechanisms, although the main mechanism appears to be the indirect activation of Adenosine Monophosphate-Kinase (AMPK) pathways on the multiple tissues, which leads to a reduction in the release of glucose by the liver, fatty acid synthesis, and stimulates glucose up take and fatty acid oxidation [12].
Recent data indicate that several drugs employed for diabetes treatment may affect skeletal metabolism [26]. Preclinical and clinical data suggest a positive [12] or neutral [17] effect of met formin on fracture risk or bone loss in diabetes mellitus. However, our results show a positive effect of metformin combined with insulin on left and right femoral BMD compared to the women’s group with insulin therapy. Also, the positive effect of metformin was observed for trunk BMC in women on oral anti-diabetic drugs only compared to women on insulin therapy. This effect also persists when metformin is combined with insulin.
However, there are no studies that test the effect of the combination of metformin with insulin on bone. Nevertheless, study conducted on patients treated with a combination of metformin and rosiglitazone and patients with metformin only founds that metformin monotherapy had a positive effect on BMD [27].
These positive effects of metformin on bone were also confirmed by a cohort study involving types 2 diabetes patients (mean age 61.7 ± 14.0 years) showing a reduction of fracture risk with biguanides therapy [28]. In addition, a larger case-control study included all fracture cases demonstrated that the metformin administration was protective against risk of fracture even after adjusting for other risk factors [29]. Moreover, in a cohort of older patients with T2DM who were followed for approximately 10 months, fracture rates for women (mean age 76 ± 7 years) using metformin were lower than those for women (mean age 77 ± 7 years) using thiazolidinediones another oral antidiabetic treatment [30]. Although, these studies are consistent with our findings on the beneficial effect of metformin on bone, however there is a lack of data on the effect of this treatment on BMD, BMC and also the effect of the combination of metformin with insulin treatment.
For Type 2 Diabetes Patients, insulin treatment reflects theseverity and long history of diabetes treatment [26]. Results from preclinical and clinical studies shows a negative effect of insulin therapy on the bone profiles in diabetes.Our results demonstrate a significantly lower BMD of the left and right femoral neck in patients treated with insulin compared to patients on insulin injection combined with oral metformin. Similarly, the lowest trunk BMC was observed in patients undergoing insulin treatment and this compared to other groups of women. In the same context, several studies have reported an increase in the number of fractures among patients with type 2 diabetes who were treated with insulin [14]. However, these data should be interpreted with caution, as patients on insulin usually have long-term disease and suffer from peripheral neuropathy that might increase the risk of falling. To avoid these risk factors, in our study the selected diabetic patients have no previous fractures and no multiple fractures in childhood. Finding from a prospective cohort study which included 3050 older Mexican American subjects, of 690 types 2 diabetes patients, 134 patients experienced higher risk of fractures with insulin treatment [31]. In addition, a prospective cohort study performed in older women have reported an elevated risk of foot fracture in women on insulin therapy compared to non-diabetic patients [32]. A study conducted by Napoli et al., suggested that diabetics individuals treated with insulin have shown increased risk of non-vertebral fracture [6]. In contrast, results from few clinical studies demonstrated that no significant association was found between the risk of fractures and insulin therapy [29,14].
Regarding resorption and formation bone markers, we have observed a lower concentration of CTX-I and P1NP in the group of women treated with a combination of metformin and insulin. The greater concentration of bone markers was observed in patient without anti-diabetic treatments. However, these results remain statistically not significant. Similarly, study conducted in patient with diabetes mellitus reported that after 24 weeks of metformin treatment, serum CTX-I level was unaffected [33]. In contrast, studies have demonstrated thatmetformin increases osteoblast-specific markers such as type I collagen and osteocalcin, and also promotes osteoblast differentiation [34,35]. Other study has also reported that metformin effectively reduces osteoclasts number and attenuates alveolar bone resorption by modulating RANKL/OPG ratio [36]. Also, Cornish et al. suggested that injection of insulin for a period of 5 days in adult mice increased bone formation and reduced bone resorption [16].
Limitations
Some limitations in our data are worth noting. First, the study population was relatively small (especially the control group) to generalize the results. Second, the cross-sectional nature of the study, which is not possible to make any cause-and-effect inference on the relationship between the different anti-diabetic treatments and bone profile. Finally, all the participants were Tunisian postmenopausal women, and our results may not be generalized to other ethnicities. On the other hand, the main novelty of the study is that it includes a group of women on combined treatment of metformin and insulin. In addition, this study is among the few studies that investigate the effect of different forms of anti-diabetic therapy on BMD, BMC and bone markers simultaneously. Additionally, no participant had taken a drug known to interfere with normal bone metabolism. Also, our relatively homogenous study population (in term of race, age and age of menopause) may have strengthened our finding since many of these factors are known to profoundly impact bone.
Conclusion
In summary, data from our study indicate that BMD in the left and right femoral neck was significantly higher in patients treated with a combination of metformin and insulin injection compared to patient with insulin monotherapy and this after adjustment by all confounding variables. In addition, trunk BMC was higher in women taking metformin medication compared to women with another anti-diabetic treatment. Our finding suggests that treatment with metformin alone or combined with insulin might be less harmful to BMD and BMC than insulin monotherapy. Therefore, our findings suggest a favorable and positive effect of metformin on bone.However, the mechanisms that underlie these results remain unclear, therefore more well-controlled prospective studies are warranted to establish the association between anti-diabetic drugs and bone parameters.
Declarations
Acknowledgements: The authors would like to express their thanks to the patients for their participation.
Funding: This work was supported by ‘’The Ministry of Higher Education and Scientific Research of Tunisia’.’
Conflict of interest: All authors have no conflicts of interest.
Ethical approval: All procedures performed in studies involving human participants were in accordance with the ethical standards of the institutional and/or national research committee and with the 1964 Helsinki declaration and its later amendments or comparable ethical standards.
Informed consent: consent was obtained from all individual participants included in the study.
References
- Bates DW, Black DM, Cummings SR. Clinical use of bone densitometry: Clinical application. JAMA. 2002; 288: 1898-1900.
- Cui R, Zhou L, Li Z, Li Q, Qi Z, et al. Assessment risk of osteoporosis in Chinese people: relationship among body mass index, serum lipid profiles, blood glucose, and bone mineral density. Clinical intervention in Aging. 2016; 11: 887-895.
- Alswat KA. Gender Disparities in Osteoporosis. J Clin Med Res. 2017; 9: 382-387.
- Hernlund E, Svedbom A, Ivergård M, J Compston, Cooper C, et al. Osteoporosis in the European Union: medical management, epidemiology and economic burden: A report prepared in collaboration with the International Osteoporosis Foundation (IOF) and the European Federation of Pharmaceutical Industry Associations (EFPIA). Arch Osteoporos. 2013; 8: 136.
- Lambrinoudaki I, Paschou SA, Armeni E, Goulis DG. The interplay between diabetes mellitus and menopause: clinical implications. Nat Rev Endocrinol. 2022; 18: 608 622.
- Koromani F, Ghatan S, van Hoek M, Zillikens MC, Oei EHG, et al. Type 2 Diabetes Mellitus and Vertebral Fracture Risk. CurrOsteoporos Rep. 2021; 19: 50 57.
- Oei L, Zillikens MC, Dehghan A, Buitendijk GH, Castano-Betancourt MC, et al. High bone mineral density and fracture risk in type 2 diabetes as skeletal complications of inadequate glucose control the Rotterdam Study. Diabetes cares. 2013; 36: 1619-1628.
- Burghardt AJ, Issever AS, Schwartz AV et al. High resolution peripheral quantitative computed tomographic imaging of cortical and trabecular bone microarchitecture in patients with type 2 diabetes mellitus. J Clin Endocrinol Metab. 2010; 95: 5045–5055.
- Farr JN, Drake MT, Amin S et al. In vivo assessment of bone quality in postmenopausal women with type 2 diabetes. J Bone Miner Res. 2014; 29: 787–795.
- Dobnig H, Piswanger-Solkner JC, Roth M, Obermayer-Pietsch B, Tiran A, et al. Type 2 diabetes mellitus in nursing home patients: Effects on bone turnover, bone mass, and fracture risk. J Clin Endocrinol Metab. 2006; 91: 3355-3363.
- Ellegaard M, Jørgensen N, Schwarz P. Parathyroid hormone and bone healing. Calcif Tissue Int. 2010; 87: 1-13.
- Nordklint AK, Almdal TP, Vestergaard P, Lundby-Christensen L, Boesgaard TW, et al. Effect of metformin and insulin vs. placebo and insulin on whole body composition in overweight patients with type 2 diabetes: A randomized placebo-controlled trial. Osteoporos Int. 2021; 32: 1837 1848.
- Zhang YS, Zheng YD, Yuan Y, Chen SC, Xie BC, et al. Effects of Anti-Diabetic Drugs on Fracture Risk: A Systematic Review and Network Meta-Analysis. Front Endocrinol (Lausanne). 2021; 12: 735824.
- Zhang Y, Chen Q, Liang Y, Dong Y, Mo X, et al. Insulin use and fracture risk in patients with type 2 diabetes: A meta‑analysis of 138,690 patients. Experimental and therapeutic medicine. 2019 ;17: 3957-3964.
- Dennison EM, Syddall HE, Aihie Sayer A, Craighead S, Phillips DI, Cooper C, et al. Type 2 diabetes mellitus is associated with increased axial bone density in men and women from the Hertfordshire Cohort Study: evidence for an indirect effect of insulin resistance. Diabetologia. 2014; 47: 1963-1968.
- Cornish J, Callon K, Reid I. Insulin increases histomorphometric indices of bone formation in vivo. Calcif Tissue Int. 1996; 59: 492-495.
- Palermo A, D’Onofrio L, Eastell R, Schwartz AV, Pozzilli P, Oral anti-diabetic drugs and fracture risk. Cut to the bone: safe or dangerous? A narrative review. Osteoporosis Int. 2015; 26: 2073-2089.
- The sixth report of joint national committee on prevention, detection, evaluation, and treatment of high blood pressure. Arch Inter Med. 1997; 157: 2413-2446.
- FriedewaldWT, Levy RI, Fredrickson DS. Estimation of the concentration of low-density lipoprotein cholesterol in plasma, without use of the preparative ultracentrifuge. Clin Chem. 1972; 18: 499‑502.
- Elm EV, Douglas GA, Egger M, Pocock SJ, Gøtzsche PC, et al. The Strengthening the Reporting of Observational Studies in Epidemiology (STROBE) statement: guidelines for reporting observational studies. Lancet. 2007; 370: 1453–1457.
- Cherif R, Mahjoub F, Sahli H, Cheour E, Sakly M, et al. Clinical and body composition predictors of bone turnover and mineral content in obese postmenopausal women. Clin Rheumatol. 2019; 38:739 747.
- Wani K, Yakout SM, Ghouse M, Ansari A, SabicoS, et al. Metabolic Syndrome in Arab Adults with Low Bone Mineral Density. Nutrients. 2019; 11:14052019.
- Zhang Q, Zhou J, Wang Q, Lu C, Xu Y, et al. Association Between Bone Mineral Density and Lipid Profile in Chinese Women. Clinical Interventions in Aging. 2020; 15:1649–1664.
- Jagtap VR, Ganu JV, Nagane NS. BMD and Serum Intact Osteocalcin in Postmenopausal Osteoporosis Women. Indian J Clin Biochem. 2011; 26: 70-73.
- Xiao Z, Tan Z, Shang J, Cheng Y, Tang Y, et al. Sex-specific and age-specific characteristics of body composition and its effect on bone mineral density in adults in southern China: a cross-sectional study. BMJ Open. 2020; 10: e032268.
- Lee HS, Hwang JS. Impact of Type 2 Diabetes Mellitus and Antidiabetic Medications on Bone Metabolism. Curr Diab Rep. 2020; 20: 78.
- Borges J, Bilezikian J, Jones‐Leone A, Acusta A, Ambery P, et al. A randomized, parallel group, double‐blind, multicentre study comparing the efficacy and safety of Avandamet (rosiglitazone/metformin) and metformin on long‐term glycaemic control and bone mineral density after 80 weeks of treatment in drug‐naïve type 2 diabetes mellitus patients. Diabetes ObesMetab. 2011; 13:1036-1046.
- Melton LJ, Leibson CL, Achenbach SJ, Therneau TM, Khosla S. Fracture risk in type 2 diabetes: update of a population‐based study. J Bone Miner Res. 2008; 23: 1334-1342.
- Vestergaard P, Rejnmark L, Mosekilde L. Relative fracture risk in patients with diabetes mellitus, and the impact of insulin and oral antidiabetic medication on relative fracture risk. Diabetologia. 2005; 48: 1292-1299.
- Solomon DH, Cadarette SM, Choudhry NK, Canning C, Levin R, et al. A cohort study of thiazolidinediones and fractures in older adults with diabetes. J Clin Endocrinol Metab. 2009; 94: 2792–2798.
- Ottenbacher KJ, Ostir GV, Peek MK, Goodwin JS, Markides KS. Diabetes mellitus as a risk factor for hip fracture in mexicanamerican older adults. J GerontolA Biol Sci Med Sci. 2002; 57: M648-653.
- Schwartz AV, Sellmeyer DE, Ensrud KE, Cauley JA, Tabor HK, et al. Older women with diabetes have an increased risk of fracture: A prospective study. J Clin Endocrinol Metab. 2001; 86: 32-38.
- Van Lierop AH, Hamdy NA, van der Meer RW, Jonker JT, Lamb HJ, et al. Distinct effects of pioglitazone and metformin on circulating sclerostin and biochemical markers of bone turnover in men with type 2 diabetes mellitus. Eur J Endocrinol. 2012; 166: 711-776.
- Dacic S, Kalajzic I, Visnjic D, Lichtler A, Rowe D. Col1a1‐Driven Transgenic Markers of Osteoblast Lineage Progression. J Bone Miner Res. 2001; 16: 1228-1236.
- Stalvey MS, Clines KL, Havasi V, McKibbin CR, Dunn LK, et al. Osteoblast CFTR inactivation reduces differentiation and osteoprotegerin expression in a mouse model of cystic fibrosis-related bone disease. PLoS One. 2013; 8:e80098.
- Liu L, Zhang C, Hu Y, Peng B. Protective effect of metformin on periapical lesions in rats by decreasing the ratio of receptor activator of nuclear factor kappa B ligand/osteoprotegerin. J Endod. 2012; 38: 943-947.