
Journal of Clinical Images and Medical Case Reports
ISSN 2766-7820
Research Article - Open Access, Volume 4
Correlation of C1q/TNF-related protein-6 and irisin with type 2 diabetes mellitus
Yating Zhang1; Lin Zhang2*
1Graduate School of Inner Mongolia Medical University 010110, China.
2Department of Endocrinology, Bayannur City Hospital, Inner Mongolia Autonomous Region 015000, China.
*Corresponding Author : Lin Zhang
Department of Endocrinology, Bayannur City Hospital, Inner Mongolia Autonomous Region 015000, China.
Email: 1374516464@qq.com
Received : May 24, 2023
Accepted : Jun 16, 2023
Published : Jun 23, 2023
Archived : www.jcimcr.org
Copyright : © Zhang L (2023).
Abstract
Aims: To investigate the correlation between C1q/TNF-Related Protein-6 (CTRP6), irisin, and Type 2 Diabetes Mellitus (T2DM).
Methods: A total of 80 T2DM patients who visited the Endocrinology Department of Bayannur City Hospital from March 2022 to October 2022 were selected as the research group, and 80 healthy subjects were selected as the normal control group. Several indicators, including serum C1q/TNF-Related Protein-6 (CTRP6), irisin, Adiponectin (ADP), Tumor Necrosis Factor Alpha (TNF-α), Interleukin 6 (IL-6), Fasting Plasma Glucose (FPG), Plasma glucose 2h after 75g glucose load (2hPG), Fasting Insulin (Fins), Homeostasis Model Assessment of Insulin Resistance (HOMA-IR), Glycated Hemoglobin (HbA1c), Body Mass Index (BMI) and Visceral Fat Area (VFA) were measured in all subjects.
Results: Compared with the control group, the serum CTRP6 level in the study group was significantly increased [(150.69 ± 29.57) vs. (116.05 ± 29.06) ng/ml, P<0.05], and the irisin level was significantly decreased [145.56 (117.5~191.75) vs. 205.2 (142.1~334.7) ng/L, P<0.05]. The results of Spearman correlation analysis showed that serum CTRP6 was positively correlated with BMI, VFA, FPG, 2hPG, Fins, HOMA-IR, HbA1c, IL-6, and TNF-α (P<0.05). Serum irisin was negatively correlated with BMI, FPG, 2hPG, HOMA-IR, and HbA1c (P<0.05) and positively correlated with ADP and IL-6 (P<0.05). Multiple linear regression analysis showed that VFA, FINS, HOMA-IR, ADP and IL-6 were independent influencing factors of CTRP6 (P<0.05), and IL-6 was an independent influencing factor of irisin (standardized β value=0.276, P<0.05). Binary logistic regression analysis showed that HOMA-IR, CTRP6 and irisin were independent predictors of T2DM. Receiver operating characteristic (ROC) curve analysis showed that the Area Under the Curve (AUC) of serum CTRP6 for predicting T2DM was 0.795, and the AUC of serum irisin for predicting T2DM was 0.669.
Conclusions: Serum CTRP6 and irisin are closely related to T2DM and have predictive value for T2DM.
Keywords: C1q/TNF-related protein-6; Irisin; Insulin resistance; Type 2 diabetes mellitus.
Citation: Zhang Y, Zhang L. Correlation of C1q/TNF-related protein-6 and irisin with type 2 diabetes mellitus. J Clin Images Med Case Rep. 2023; 4(6): 2470.
Introduction
Type 2 Diabetes Mellitus (T2DM) is associated with pancreatic β-cell dysfunction, macrophage infiltration, and systemic low-grade inflammation [1]. In recent years, T2DM has been found to be closely related to adipocytokines. Adipose tissue not only stores energy but is also an active endocrine organ, secreting a variety of peptide hormones, and these secreted proteins are called adipocytokines. Dysfunction of adipocytokines can lead to changes in lipid formation and carbohydrate synthesis, which affects lipid and glucose metabolism and leads to insulin resistance and T2DM [1]. At present, hundreds of adipocytokines have been discovered in humans, such as Interleukin 6 (IL-6), visceral adipose tissue-derived serine protease inhibitor (Vaspin), Adiponectin (ADP), leptin, IL-1β, and Tumor Necrosis Factor Alpla (TNF-α). These factors can participate in the regulation of glucose and lipid metabolism, insulin sensitivity and the inflammatory response in the human whole body through mechanisms of endocrine, paracrine, and autocrine [2].
C1q/TNF-Related Proteins (CTRPs) are a family that has been found to be homologous to ADP, including 15 family members from CTRP1 to CTRP15. All CTRP members are secreted proteins and are widely expressed in various tissues and cells [3]. C1q/TNFα-related protein-6 (CTRP6) is a 29kDa adipocytokine consisting of four domains, including an amino-terminal signal peptide, a short variable domain, a collagen-like repeatable domain, and a carboxy-terminal complement C1q-like globular domain [4]. As a member of the CTRP family, CTRP6 is widely expressed in a variety of tissues and organs, including adipose tissue, heart, brain, and placenta, and it has been shown to play a role in fat metabolism, glucose metabolism, myocardial metabolism, inflammation, and autoimmunity [3,5].
Irisin is a newly discovered myokine that is produced by the exercise-induced hydrolysis of Fibronectin type III Domain-Containing protein 5 (FNDC5) in skeletal muscle. In recent years, irisin has been found to be involved in some of the body’s energy metabolism, brown-like changes in white fat, and insulin resistance [6]. A study by Bostrom et al., reported that exercise- and pgc-1a-induced myokine irisin drives the browning of white fat, and brown adipose tissue affects systemic metabolism and may affect insulin sensitivity [7]. Another study showed that in a high-fat-fed mouse model, high expression of irisin significantly improved the glucose tolerance level of mice and reduced the fasting insulin level of mice [7].
Therefore, this study intends to explore the relationship between CTRP6 and irisin and T2DM by analyzing the serum levels of CTRP6 and irisin in the normal population and newly diagnosed T2DM population.
Materials and methods
Research subjects
A total of 80 patients (31 males and 49 females) who were initially diagnosed with T2DM at the Endocrinology Department of Bayannur City Hospital from March 2022 to October 2022 were selected. All subjects met the T2DM diagnostic criteria of the World Health Organization (WHO). They were all diagnosed for the first time and had not used hypoglycemic drugs, insulin, and diet and exercise therapy. At the same time, 80 healthy subjects were recruited as the normal control group (34 males and 46 females).
Exclusion criteria: (1) age <18 years old or >70 years old; (2) type 1 diabetes mellitus or other types of diabetes mellitus; (3) other endocrine diseases, such as acute complications of T2DM mellitus, thyroid disease, etc.; (4) taking antihypertensive or lipid-lowering medications; (5) severe liver and kidney insufficiency; (6) pregnancy; and (7) patients with cardiovascular and cerebrovascular diseases. This study complied with the ethical guidelines of the Declaration of Helsinki and was approved by the Medical Ethics Committee of Bayannur Hospital, Inner Mongolia Autonomous Region, and all subjects signed an informed consent.
Research methods
A medical history was collected, and a questionnaire was completed to collect general information on all subjects: age, sex, history of disease, family history, and medication history. A unified method was used to measure and record anthropometric parameters: body weight, height, waist circumference, hip circumference, body fat ratio, systolic blood pressure, and diastolic blood pressure. Body Mass Index (BMI) was calculated as BMI=weight (kg)/height (m)2. The Visceral Fat Area (VFA) was measured by the bioelectrical impedance method (OMRON HDS-2000), the abdominal cross-sectional area at the transumbilical plane was calculated by scanning the abdomen shape, and the nonfat area and Subcutaneous Fat Area (SFA) were calculated by two sets of electrodes on the limbs and trunk. VFA=abdominal cross-sectional area - nonfat area - SFA.
Fasting venous blood was collected from all subjects in the morning to detect Fasting Plasma Glucose (FPG), Fasting Insulin (FINS), and glycosylated hemoglobin (HbA1c). All subjects underwent an Oral Glucose Tolerance Test (OGTT) to detect plasma glucose 2h after 75g glucose load (2hPG). All subjects were tested at Bayannur City Hospital, Inner Mongolia Autonomous Region. The Homeostatic Model-Assessed Insulin Resistance, (HOMA-IR) =FINS*FPG/22.5, was calculated.
Detection of serum CTRP6, irisin, ADP, TNF-α, and IL-6
The levels of serum CTRP6, irisin, ADP, TNF-α and IL-6 were detected by Enzyme-Linked Immunosorbent Assay (ELISA). The detection ranges were 5-180 pg/mL, 6-280 pg/mL, 80-2000 pg/mL, 20-400 ng/L, and 0.8-20 ng/L, respectively. The kits were purchased from Shanghai Hengyuan Biotechnology Co, Ltd. And used in strict accordance with the manufacturer’s instructions.
Statistical analysis
SPSS 26.0 statistical software was used for data analysis. The measurement data were tested for normality. Measurement data that conformed to a normal distribution are expressed as and subjected to the t test. Measurement data that did not conform to the normal distribution are expressed as M (P 25 ~P 75). The rank sum test and Spearman correlation analysis were used. Factors that influence serum CTRP6 and irisin were analyzed by multiple linear regression. A binary logistic regression model was used to analyze the relationship between serum CTRP6 and irisin and T2DM. Receiver operating characteristic (ROC) curves were used to analyze the predictive value of serum CTRP6 and irisin for T2DM. P< 0.05 and P< 0.0001 were considered statistically significant differences.
Table 1: Comparison of clinical indicators between the normal and T2DM groups.
| Factor | NGT (n = 80) | T2DM (n = 80) | P |
|---|---|---|---|
| Sex (F/M) | 46/34 | 49/31 | 0.629 |
| Age (y) | 45.33 ± 11.19 | 48.44 ± 10.72 | 0.074 |
| BMI (kg/m2) | 24.39 ± 2.88 | 27.87 ± 4.19 | < 0.05 |
| VFA (cm2) | 102.46 ± 28.69 | 116.31 ± 39.94 | < 0.05 |
| FPG (mmol/L) | 4.77 ± 0.45 | 9.37 ± 2.81 | < 0.05 |
| 2hPG (mmol/L) | 5.65 ± 1.06 | 17.58 ± 4.57 | < 0.05 |
| Fins (μU/mL) | 10.72 (7.34 – 15.93) | 11.6 (7.73 – 15.9) | 0.548 |
| HOMA-IR | 2.42 (1.48 – 3.53) | 4.53 (3.1 – 6.98) | < 0.05 |
| HbA1c (%) | 5.49 ± 0.31 | 8.82 ± 2.04 | < 0.05 |
| ADP (pg/mL) | 2050.5 (1252.2 – 2797.69) | 1379.64 (907.45 – 2010.7) | < 0.05 |
| IL-6 (ng/L) | 9.01 ± 3.28 | 10.66 ± 4.97 | < 0.05 |
| TNF-α (ng/L) | 261.03 ± 45.99 | 287.15 ± 61.03 | < 0.05 |
| CTRP6 (ng/L) | 116.05 ± 29.06 | 150.69 ± 29.57 | < 0.05 |
| Irisin (ng/L) | 205.19 (142.15 – 334.69) | 145.56 (117.5 – 191.75) | < 0.05 |
Abbreviations: 2hpg: 2h Plasma Glucose; ADP: Adiponectin; BMI: Body Mass Index; Fins: Fasting Plasma Insulin; FPG: Fasting Plasma Glucose; Hbalc: Hemoglobin alc; HOMA-IR: Homeostasis Model Assessment of Insulin Resistance; IL-6: Interleukin 6; TNF- α: Tumor Necrosis Factor Alpla; VFA: Visceral Fat Area.
Results
Analysis of clinical indicators of the two groups of study populations
The sex and age of the T2DM group and the normal group were comparable, and the difference was not statistically significant (P>0.05). Compared with the normal group, the levels of BMI, VFA, FPG, 2hPG, HOMA-IR, HbA1c, IL-6, TNF-α, and CTRP6 in the T2DM group were significantly increased, while the levels of ADP and irisin were significantly decreased (P< 0.05, Table 1).
Serum CTRP6 and irisin levels of the two groups of study populations
Compared with the normal group, the level of CTRP6 was significantly increased, and the level of irisin was significantly decreased in the T2DM group (P< 0.0001 Figure 1). According to the insulin resistance index (IR), subjects were divided into a no-IR group and an IR group, for which IR≤3 was defined as the non-IR group and IR>3 was defined as the IR group. The results showed that the serum CTRP6 level in the IR group was significantly higher than that in the non-IR group in the T2DM population (P< 0.05, Figure 2).
Correlation analysis between serum CTRP6 and irisin and clinical indicators
The results of Spearman correlation analysis showed that serum CTRP6 was positively correlated with BMI, VFA, FPG, 2hPG, Fins, HOMA-IR, HbA1c, IL-6, and TNF-α (P< 0.05, Table 2). Serum irisin was negatively correlated with BMI, FPG, 2hPG, HOMA-IR, and HbA1c and positively correlated with ADP and IL-6 (P< 0.05, Table 2).
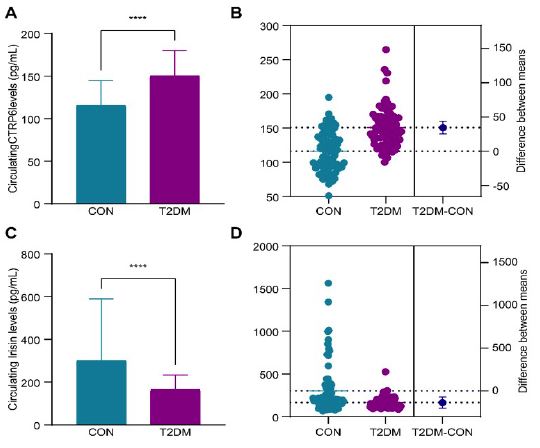
Note: CON is the normal group and T2DM is the Type 2 diabetes mellitus group, ****P < 0.0001 vs CON.
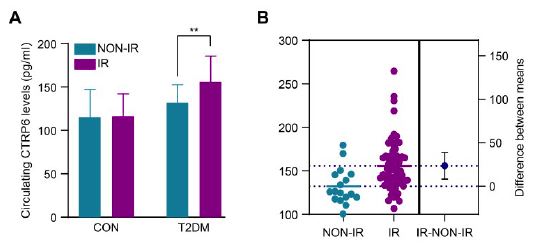
Note: CON is the normal group, T2DM is the type 2 diabetes mellitus group, NON-IR is the non-insulin resistance group, IR is the insulin resistance group,**P< 0.05 vs NON-IR.
Table 2: Correlation analysis of serum CTRP6 and Irisin with clinical indicators in the T2DM group.
| Factor | CTRP6 | Irisin | ||
|---|---|---|---|---|
| r | P | r | P | |
| Age (y) | -0.113 | 0.039 | -0.031 | 0.872 |
| BMI (kg/m2) | 0.255 | < 0.05 | -0.201 | < 0.05 |
| VFA (cm2) | 0.243 | < 0.05 | -0.119 | 0.133 |
| FPG (mmol/L) | 0.500 | < 0.05 | -0.295 | < 0.05 |
| 2hPG (mmol/L) | 0.434 | < 0.05 | -0.278 | < 0.05 |
| Fins (μU/mL) | 0.237 | < 0.05 | -0.055 | 0.493 |
| HOMA-IR | 0.456 | < 0.05 | -0.234 | < 0.05 |
| HbA1c (%) | 0.470 | < 0.05 | -0.352 | < 0.05 |
| ADP (pg/mL) | -0.150 | 0.059 | 0.248 | < 0.05 |
| IL-6 (ng/L) | 0.284 | < 0.05 | 0.248 | < 0.05 |
| TNF-α (ng/L) | 0.222 | < 0.05 | -0.013 | 0.872 |
| CTRP6 (ng/L) | - | - | -0.134 | 0.092 |
| Irisin (ng/L) | -0.134 | 0.092 | - | - |
Abbreviations: 2hpg: 2h Plasma Glucose; ADP: Adiponectin; BMI: Body Mass Index; Fins: Fasting Plasma Insulin; FPG: Fasting Plasma Glucose; Hbalc: Hemoglobin alc; HOMA-IR: Homeostasis Model Assessment of Insulin Resistance; IL-6: Interleukin 6; TNF- α: Tumor Necrosis Factor Alpla; VFA: Visceral Fat Area.
Multiple linear regression analysis of the influencing factors of serum CTRP6 and irisin
Multiple linear regression analysis was performed with CTRP6 and irisin as dependent variables, and the independent variables were age, BMI, VFA, FPG, 2hPG, FINS, HOMA-IR, Hb1Ac, ADP, IL-6, and TNF-α. The results showed that VFA, Fins, HOMA-IR, ADP and IL-6 were independent influencing factors of CTRP6 (P< 0.05, Table 3); IL-6 was an independent influencing factor of irisin (P< 0.05, Table 3).
Table 3: Multiple linear regression analysis of the factors affecting serum CTRP6 and irisin in the T2DM group
| Factor | CTRP6 | Irisin | ||
|---|---|---|---|---|
| β | P | β | P | |
| Age (y) | -0.112 | 0.081 | -0.061 | 0.440 |
| BMI (kg/m2) | -0.122 | 0.164 | -0.163 | 0.126 |
| VFA (cm2) | 0.222 | < 0.05 | 0.125 | 0.205 |
| FPG (mmol/L) | -0.121 | 0.455 | -0.219 | 0.270 |
| 2hPG (mmol/L) | 0.245 | 0.109 | -0.017 | 0.928 |
| Fins (μU/mL) | -0.449 | < 0.05 | -0.257 | 0.181 |
| HOMA-IR | 0.814 | < 0.05 | 0.290 | 0.199 |
| HbA1c (%) | -0.011 | 0.931 | -0.210 | 0.171 |
| ADP (pg/mL) | 0.140 | < 0.05 | 0.068 | 0.394 |
| IL-6 (ng/L) | 0.203 | < 0.05 | 0.276 | < 0.05 |
| TNF-α (ng/L) | 0.054 | 0.396 | 0.000 | 0.998 |
Abbreviations: 2hpg: 2h Plasma Glucose; ADP: Adiponectin; BMI: Body Mass Index; Fins: Fasting Plasma Insulin; FPG: Fasting Plasma Glucose; Hbalc: Hemoglobin alc; HOMA-IR: Homeostasis Model Assessment of Insulin Resistance; IL-6: Interleukin 6; TNF-α: Tumor Necrosis Factor Alpla; VFA: Visceral Fat Area.
Relationship between serum CTRP6 and irisin and T2DM
Taking T2DM as the dependent variable, HOMA-IR, CTRP6, and irisin, which were statistically significantly correlated in univariate analysis, were selected as the independent variables and substituted into the binary logistic regression model. The results showed that HOMA-IR, CTRP6 and irisin were independent predictors of T2DM. Among these predictors, each increase of HOMA-IR by one unit increased the risk of T2DM by 23.6% (OR=1.236, 95% CI: 1.025-1.490, P< 0.05), and each increase in CTRP6 by 1 ng/mL increased the risk of T2DM by 4.0% (OR=1.040, 95% CI: 1.023~1.057, P<0.05). Every 1 ng/mL decrease in irisin was associated with a 0.6% increase in the risk of T2DM (OR=0.994, 95% CI: 0.989-0.999, P< 0.05) (Table 4).
Table 4: Binary logistic regression analysis of the association of serum CTRP6 and Irisin with T2DM
| Variable | β | SE | Wald χ2 | P | OR | 95% CI |
|---|---|---|---|---|---|---|
| HOMA-IR | 0.212 | 0.095 | 4.912 | < 0.05 | 1.236 | 1.025 – 1.490 |
| CTRP6 (ng/mL) | 0.039 | 0.008 | 21.154 | < 0.05 | 1.040 | 1.023 – 1.057 |
| Irisin (ng/mL) | -0.006 | 0.002 | 6.025 | < 0.05 | 0.994 | 0.989 – 0.999 |
Abbreviations: HOMA-IR: The Homeostasis Model Assessment of Insulin Resistance; CI: Confidence Interval; OR: Odds Radio.
Predictive value of serum CTRP6 and irisin in T2DM
ROC curve analysis showed that the optimal cutoff value of serum CTRP6 for predicting T2DM was 121.8 μg/L [sensitivity: 86.3%, specificity: 58.8%, AUC: 0.795 (95% CI: 0.727-0.863), P< 0.0001, Figure 3]; the optimal cutoff value of serum irisin for predicting T2DM was 193.3 μg/L [sensitivity: 76.3%, specificity: 56.3%, AUC: 0.669 (95% CI: 0.585~0.755), P< 0.0001, Figure 3].

Discussion
The adipocytokines CTRP6 and irisin may be involved in the regulation of energy metabolism, insulin resistance, and systemic low-grade inflammation in the body, but these findings have not yet been clinically confirmed [8-11]. The results of this study showed that CTRP6 was significantly increased in the serum of patients newly diagnosed with T2DM and was positively correlated with blood glucose and the insulin resistance index, which were independent predictors of T2DM. Every 1 ng/mL increase in CTRP6 was associated with 4.0% increased risk of T2DM. Irisin was significantly decreased in the serum of patients newly diagnosed with T2DM and was negatively correlated with blood glucose and insulin resistance index, which were independent predictors of T2DM. Every 1 ng/mL decrease in irisin was associated with a 0.6% increase in the risk of T2DM. In addition, the AUC of serum CTRP6 for predicting T2DM was 0.795 (95% CI: 0.727-0.863), and the AUC of serum irisin for predicting T2DM was 0.669 (95% CI: 0.585-0.755). Therefore, we hypothesize that serum CTRP6 and irisin are associated with T2DM and have predictive value for T2DM.
Previous studies [8,12] have shown that CTRP6 is highly expressed in the serum of patients with T2DM, while irisin is significantly reduced in the serum of patients with T2DM, which is consistent with our findings. In addition, animal experiments have demonstrated that the expression of CTRP6 in adipose tissue of High-Fat Diet (HFD)-fed ob/ob mice and ADP-knockout mice is elevated, and rosiglitazone treatment can reduce the expression of CTRP6 in fat tissues of ob/ob mice [13]. High expression of CTRP6 can increase insulin sensitivity in mice, while low expression of CTRP6 can improve insulin sensitivity and reduce inflammatory responses in mice [14]. Irisin can improve glucose metabolism disorder in T2DM mice by reducing hepatic gluconeogenesis and insulin resistance [15]. Therefore, we hypothesized that serum CTRP6 and irisin are related to the occurrence of insulin resistance and T2DM. However, due to the limitations of cross-sectional studies, we still do not know whether the changes in the levels of these factors are adaptive defensive responses to insulin resistance, T2DM, and other metabolic disorders, and further studies are needed to prove this hypothesis.
Insulin resistance is closely related to the occurrence and development of T2DM and is an important feature of T2DM [16]. Because CTRP6 may play a key role in the development of insulin resistance, we examined the relationship between CTRP6 and irisin and parameters related to insulin resistance. This study showed that serum CTRP6 and irisin were significantly correlated with FPG, 2hPG, HOMA-R, and Fins. Serum CTRP6 was highly expressed in insulin-resistant people (Figure 2), and HOMA-IR and Fins were independent influencing factors of CTRP6. ADP is an insulin-sensitizing hormone secreted by adipocytes that can improve insulin resistance in mice [17]. The results of this study showed that ADP was significantly reduced in the serum of patients with T2DM, and ADP was significantly correlated with irisin, and ADP was an independent influencing factor of CTRP6. Therefore, serum CTRP6 and irisin may be related to insulin resistance. Although the exact mechanism by which serum CTRP6 and irisin are involved in T2DM and insulin resistance could not be determined in this study, they play an important regulatory role in glucose metabolism and insulin signal transduction pathways.
Over the past few decades, chronic low-grade inflammation has been recognized as an important feature of T2DM [18]. IL-6 and TNF-α are important markers of chronic low-grade inflammation and play an important role in the pathogenesis of T2DM [19]. Li et al., [20]. found that serum TNF-α and IL-6 levels were higher in patients with T2DM than in the normal population. Leinonen et al. [21] found that serum inflammatory markers, such as CRP, IL-6, and SAA, were higher in T2DM patients than in the normal population. Several domestic and foreign studies also showed that the level of IL-6 in the peripheral blood was significantly higher in T2DM patients than in the normal population [22]. Therefore, we examined the serum levels of IL-6 and TNF-α in the normal population and T2DM population. Consistent with previous findings, IL-6 and TNF-α were significantly increased in the serum of patients with T2DM. A recent study showed that knocking out CTRP6 in mice results in significant reductions in TNF-α, IL-1β, and IL-6 in glomerular mesangial cells stimulated by high glucose [23]. Another study confirmed that irisin can block intestinal inflammatory changes by reducing the levels of TNF-α and Receptor Activator of Nuclear Factor-Kappa B Ligand (RANKL) [23]. Furthermore, IL-6 can directly act on leukocytes by coupling the JAK2/STAT3 signaling pathway to inhibit the secretion of irisin [24]. Because CTRP6 and irisin play key roles in the development of inflammation, we investigated the relationship between serum CTRP6 and irisin and inflammatory factors. The study showed that CTRP6 was positively significantly correlated with IL-6 and TNF-α, irisin was positively and significantly correlated with IL-6, and IL-6 was an independent factor of CTRP6 and irisin. Therefore, further research is needed to explore relationship between serum CTRP6 and irisin and inflammatory factors in T2DM patients and the role of CTRP6 and irisin in the inflammatory response.
This study has certain limitations. First, this study is a single-center, small sample, cross-sectional study, and the causal relationship between serum CTRP6 and irisin and T2DM cannot be speculated. Second, the recruited populations in this study were all from Inner Mongolia, China. The results of this study need to be confirmed by multicenter, large-sample, and prospective cohort studies.
Statements and declarations
Fundings: The project was supported by Inner Mongolia Autonomous Region Science and Technology Program (Fund No. 2021GG0282).
Competing interests: There are no conflicts of interest to report.
Ethical approval: This study complied with the 1964 ethical guidelines of the Declaration of Helsinki and was approved by the Medical Ethics Committee of Bayannaoer Hospital, Inner Mongolia Autonomous Region.
Consent to participate: All subjects signed an informed consent.
Authors' contributions: Yating Zhang was responsible for conducting the research, collecting and organizing data, analyzing and interpreting the data, statistical analysis, and drafting the manuscript; Lin Zhang conceived and designed the article, implemented the research, analyzed and interpreted the results, revised the manuscript, reviewed, and supervised the overall article.
References
- Kojta I, Chacińska M, Błachnio-Zabielska A. Obesity, bioactive lipids, and adipose tissue inflammation in insulin resistance. Nutrients. 2020; 12: 1305.
- Dali-Youcef N, Mecili M, Ricci R, Andrès E. Metabolic inflammation: connecting obesity and insulin resistance. Ann Med. 2013; 45: 242-253.
- Zhang A, Kong M, Zhang X, Pei Z. Mechanism of action of CTRP6 in the regulation of tumorigenesis in the digestive system. Oncol Lett. 2022; 24: 391.
- Wu W, Zhang J, Zhao C, Sun Y, Yin Y, et al. Lentivirus-mediated CTRP6 silencing ameliorates diet-induced obesity in mice. Exp Cell Res. 2018; 367: 15-23.
- Zhang J, Bai WP. C1q/tumor necrosis factor related protein 6 (CTRP6) regulates the phenotypes of high glucose-induced gestational trophoblast cells via Peroxisome Proliferator-Activated Receptor gamma (PPARγ) signaling. Bioengineered. 2022; 13: 206-216.
- Chen N, Li Q, Liu J, Jia S. Irisin, et al. an exercise-induced myokine as a metabolic regulator: an updated narrative review. Diabetes Metab Res Rev. 2016; 32:51-59.
- Boström P, Wu J, Jedrychowski MP, Korde A, Ye L, et al. A PGC1-α-dependent myokine that drives brown-fat-like development of white fat and thermogenesis. Nature. 2012; 481: 463-468.
- Wang M, Tang X, Li L, Liu D, Liu H, et al. C1q/TNF-related protein-6 is associated with insulin resistance and the development of diabetes in Chinese population. Acta Diabetol. 2018; 55: 1221-1229.
- Gonzalez-Gil AM, Elizondo-Montemayor L. The role of exercise in the interplay between myokines, hepatokines, osteokines, adipokines, and modulation of inflammation for energy substrate redistribution and fat mass loss: a review. Nutrients. 2020; 12:1899.
- Guardia LD, Codella R. Exercise tolls the bell for key mediators of low-grade inflammation in dysmetabolic conditions. Cytokine Growth Factor Rev. 2021; 62: 83-93.
- Torres S, Fabersani E, Marquez A, Gauffin-Cano P. Adipose tissue inflammation and metabolic syndrome. The proactive role of probiotics. Eur J Nutr. 2019; 58:27-43.
- Wang X, Hu T, Ruan Y, Yao J, Shen H, et al. The association of serum irisin with bone mineral density and turnover markers in new-onset type 2 diabetic patients. Int J Endocrinol. 2022; 7808393.
- Lei X, Seldin MM, Little HC, Choy N, Klonisch T, et al. C1q/TNF-related protein 6 (CTRP6) links obesity to adipose tissue inflammation and insulin resistance. J Biol Chem. 2017; 292: 14836-14850.
- Lahav R, Haim Y, Bhandarkar NS, Levin L, Chalifa-Caspi V, et al. CTRP6 rapidly responds to acute nutritional changes, regulating adipose tissue expansion and inflammation in mice. Am J Physiol Endocrinol Metab. 2021; 321: E702-E713.
- Liu TY, Shi CX, Gao R, Sun HJ, Xiong XQ, et al. Irisin inhibits hepatic gluconeogenesis and increases glycogen synthesis via the PI3K/Akt pathway in type 2 diabetic mice and hepatocytes. Clin Sci (Lond). 2015; 129: 839-850.
- Ahlqvist E, Prasad RB, Groop L. Subtypes of type 2 diabetes determined from clinical parameters. Diabetes. 2020; 69: 2086-2093.
- Stromsdorfer KL, Yamaguchi S, Yoon MJ, Moseley AC, Franczyk MP, et al. NAMPT-mediated NAD (+) biosynthesis in adipocytes regulates adipose tissue function and multi-organ insulin sensitivity in mice. Cell Rep. 2016; 16: 1851-1860.
- Kolb H, Mandrup-Poulsen T. The global diabetes epidemic as a consequence of lifestyle-induced low-grade inflammation. Diabetologia. 2010; 53: 10-20.
- Mirza S, Hossain M, Mathews C, Martinez P, Pino P, et al. Type 2-diabetes is associated with elevated levels of TNF-alpha, IL-6 and adiponectin and low levels of leptin in a population of Mexican Americans: a cross-sectional study. Cytokine. 2012; 57: 136-142.
- Li X, Zhu J, Liu N, Liu J, Zhang Z. TNF-alpha in peripheral neuropathy patients with impaired glucose regulation. J Diabetes Res. 2017; 7024024.
- Hiukka A, Westerbacka J, Leinonen ES, Watanabe H, Wiklund O, et al. Long-term effects of fenofibrate on carotid intima-media thickness and augmentation index in subjects with type 2 diabetes mellitus. J Am Coll Cardiol. 2008; 52: 2190-2197.
- Akbari M, Hassan-Zadeh V. Hyperglycemia affects the expression of inflammatory genes in peripheral blood mononuclear cells of patients with type 2 diabetes. Immunol Invest. 2018; 47: 654-665.
- Xu E, Yin C, Yi X, Liu Y. Knockdown of CTRP6 inhibits high glucose-induced oxidative stress, inflammation and extracellular matrix accumulation in mesangial cells through regulating the Akt/NF-κB pathway. Clin Exp Pharmacol Physiol. 2020; 47: 1203-1211.
- Yan Y, Dong R, Zhang C, Jiang Q. Interleukin-6 mediates lipopolysaccharide-inhibited irisin secretion in Nile tilapia (oreochromis niloticus). Fish Shellfish Immunol. 2022; 121: 99-107.