
Journal of Clinical Images and Medical Case Reports
ISSN 2766-7820
Research Article - Open Access, Volume 4
Determinants of neonatal mortality in Amhara regional state, Ethiopia: Further investigation of EDHS 2016
Henok Wolde*
Addis Ababa University, College of Development Studies, Center for Population Studies, Ethiopia.
*Corresponding Author : Henok Wolde
Center for Population Studies, College of Development Studies, Addis Ababa University, Ethiopia.
Email: rad.heni2015@gmail.com
Received : Aug 15, 2023
Accepted : Sep 11, 2023
Published : Sep 18, 2023
Archived : www.jcimcr.org
Copyright : © Wolde H (2023).
Abstract
Background: Globally, 2.4 million newborns died in the first month of life in 2019, approximately 6,700 newborn deaths every day-with about a third of all neonatal deaths occurring within the first day after birth and occurring within the first week of life [1]. Progress in reducing newborn mortality is slower than mortality in older ages, and the share of neonatal deaths relative to all under-five deaths has increased; neonatal mortality declined more slowly than mortality among children aged 1-59 months [2].
Objectives: This study’s main focus was determinants of neonatal mortality. The current study considered the Amhara region, for this study, the EDHS 2016 dataset was used.
Methods: EDHS 2016 employed a quantitative approach community-based cross-sectional study design. The target group for this study was all neonates in the Amhara population; the study participant included all live births born from interviewed reproductive-age women in Amhara regional state. The data on 4638 live birth which was extracted from EDHS 2016, was analyzed using Kaplan Meier and Cox regression models.
Result: The prevalence of neonatal mortality in the region is 47 per 1000. The study participants (82.6%) were Orthodox by religion, and (79.5%) women had no education i.e., more than four out of six mothers. Similarly, (92%) of women were rural residents, and 67.8.2%) of husbands hadn’t an education. About (39.9%) of the participants were poor by the combined wealth index of the family. Moreover, around (80.6%) did not listen to the radio, and (97.4%) of the participant had unimproved toilet facilities. Gender characteristics of neonates had a significant impact on neonatal mortality, with girls having 40% less risk of mortality as compared to boys (aHR = 0.60, 95% CI: 0.44-0.83).Preceding birth interval had statistically significant effect on the risk of neonatal mortality (Likelihood ratio p-value < 0.05). Neonates whose mothers had a preceding birth interval greater than 24 months had 30% less risk of mortality than neonates whose mothers preceded birth interval of fewer than 24 months (aHR = 0.70, 95% CI: 0.51-0.96).
Conclusion and recommendation: The prevalence of neonatal mortality in the Amhara region was higher (4.7%). In this study, the risk factors for newborn mortality were the sex of the child, wealth index, and place of residence preceding and succeeding birth interval. Based on the finding of this study, the following recommendations are forwarded: Strengthening public health efforts to expand health education programs to educate mothers about the benefit of the birth interval, and birth order to reduce neonatal mortality.
Citation: Wolde H. Determinants of neonatal mortality in Amhara regional state, Ethiopia: Further investigation of EDHS 2016. J Clin Images Med Case Rep. 2023; 4(9): 2594.
Background
Neonatal mortality is the possibility of dying within the first month of life, and the neonatal mortality rate is the number of deaths during the first 28 completed days of life per 1000 live births in a given period (WHO, 2016) [3]. Therefore, neonatal mortality is defined as a newborn death occurring within the first four weeks of life, and in the first month of life, newborns have the highest risk of dying [3].
Neonatal mortality has remained at the top of public health and international development agencies’ agendas because it cannot meet Sustainable Development Goals (SDGs) for child survival without a significant decrease [4]. Reducing newborn death would be important to achieve both the neonatal and under-five mortality targets of the sustainable development goals, the SDGs have two specific targets to reduce the NMR and under-five mortality rate to 12 and 25 per 1000 live births within 2030 [4].
The world neonatal mortality rate fell from 37 deaths per 1,000 live births in 1990 to 19 per 1,000 in 2016; however, the decline in the neonatal mortality rate from 1990 to 2016 was slower than the decline in mortality among children aged 1-59 months: 49 percent, compared with 62 percent, a pattern consistent across all regions [5]. Black Africa had the highest neonatal mortality rate in 2019 with 27 deaths per 1,000 live births, followed by Central and Southern Asia with 24 deaths per 1,000 live births, and a child born in black Africa or in Southern Asia is ten times more likely to die in the first month than a newborn in a high-income country [2].
In Ethiopia, the neonatal mortality rate ranges between 29 deaths per 1000 live births and 33 deaths per 1000 live births according to DHS 2016 and DHS 2019, respectively. Despite significant reductions in neonatal death rates since 2000 in Ethiopia (49 per 1000 live births) to 2019 (33 per 1000 live births), the neonatal mortality reduction in the Amhara region is at a stable state (47 per 1000 in 2016 and 46 per 1000 live births in 2019) compared to other regions of the country (CSA and ICF International, 2016, CSA and ICF International, 2019) [6] regional differences were also observed in neonatal mortality with a higher rate in Amhara Regional State (46/1000 live births) than most of other regional states of Ethiopia.
The socioeconomic, demographic, and maternal factors (age of the mother, level of education, wealth index, contraceptive use, antenatal care, breastfeeding, etc.) associated with this neonatal mortality are not identified, and given the scarcity of individual and household level studies carried out on the entire Amhara population. In Amhara region, there are limited studies that look at the importance of the association between each determinant and NM. In addition, to my knowledge, no studies have used the recent Demographic Health Survey that was conducted in Ethiopia in the year 2016 regarding this problem in Amhara region. Thus, methodologically sound and representative study needs to be done far, more essentially in the area where higher NMR has been reported, and the Amhara regional state is an example. The current study, since it is based on EDHS data collected in households, addressed all mothers who gave birth at home and in the hospitals and the study will provide better knowledge on filling the gap of the study’s results to generalize to the entire population than studies conducted in hospitals. Therefore, this study is designed to investigate the determinants of neonatal mortality using the nationally and regionally representative Ethiopian Demographic and Health Survey data.
Methods and materials
The study used data from the Ethiopian Demographic and Health Surveys (EDHS) 2016 which was the fourth demographic and health survey. EDHS were strengthened by the Central Statistical Agency (CSA) with support obtained from the Ministry of Health. EDHS 2016 employed a quantitative approach to community-based cross-sectional study design. All live births who were born from interviewed 15 to 49 reproductive age women in the Amhara regional state. The Ethiopia Population and Housing Census, carried out in 2007 by the Ethiopia Central Statistical Agency, served as the sampling frame for the 2016 demographic and health service [6]. The sample was stratified and selected in two stages each region was stratified into urban and rural areas Samples of EAs were selected independently in each stratum in two stages [6]. The study participants were extracted from the dataset file ETBR71FL eligible women were identified for the interview of those who completed the interviews the sample for this specific study was used all live births which is 4638 live birth was eligible for the current analysis. The data collection period was from January 18, 2016, to June 27, 2016.
The data were analyzed using IBM SPSS version 26. Simple descriptive statistics such as frequency tabulation and percentages were used to summarize variables and evaluate the distribution of responses. Kaplan-Meier survival curve were used to show the pattern of neonatal death in 28days. Independent and adjusted relationships of different predictors with neonates’ survival were assessed with the Cox regression model. Both bivariable and multivariable Cox regression analyses with complex sampling designs were performed to identify determinants of neonatal mortality. In addition, only those variables that were significant in the bivariable analysis were further analyzed using multivariable Cox regression. A p-value less than 0.05 were considered significant, and odds ratios at 95 percent confidence intervals were computed.
The EDHS 2016 was approved by the ethics review board of the ICF Macro International and the Ministry of Health and EPHI. As the DHS dataset is open to the public domain registering to the DHS website (www.dhsprogram.com) is enough to settle ethical issues concerning the use of the dataset.
Results
The study’s findings, which included frequency, cross tabulation, percentage, Kaplan-Meier, and Cox regression, were reported in this section. Subsections were used to depict the distribution of variables in relation to the dependent variable. The association between the explanatory and outcome factors was also studied using multivariable Cox regression, and the results are given.
To ascertain the elements influencing maternal, socioeconomic, and demographic determinants on infant survival, 4,638 neonates were evaluated in total.
Table 1: Percentage distribution of neonatal death and mortality rate in Amhara region, 2016 EDHS (n = 4638).
| Variables | Frequency | Numberof deaths | NMRper 1000 |
|---|---|---|---|
| DependentVariable | |||
| Neonatal death | |||
| No | 4420(95.3) | 218(4.7) | 47 |
| Yes | 218(4.7) | ||
| IndependentVariable | |||
| Sex of child | |||
| Male | 2334(50.3) | 137(62.8) | 30 |
| Female | 2304(49.7) | 81(37.2) | 17 |
| Place of residence | |||
| Urban | 372(8.0) | 8(3.7) | 2 |
| Rural | 4266(92.0) | 210(96.3) | 45 |
| Preceding Birthinterval | |||
| 24 Months | 385(8.3) | 51(23.6) | 11 |
| 24Months | 3092(66.6) | 167(76.4) | 36 |
| missing1161 (25.1) | |||
| Birth order | |||
| 1stbirth order | 1160(25) | 50(22.9) | 11 |
| 2ndbirth order | 956(20.6) | 46(21.1) | 10 |
| 3rdbirth order | 763(16.4) | 29(13.3) | `6 |
| 4thbirth order and above | 1759(38) | 93(42.6) | 20 |
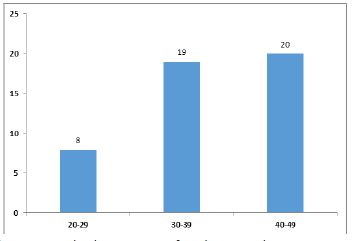
| Maternal age group | |||
| 20-29 | 872(18.9) | 38(17.4) | 8 |
| 30-39 | 1962(42.3) | 89(40.8) | 19 |
| 40-49 | 1804(38.8) | 91(41.7) | 20 |
| Succeeding birth interval | |||
| < 24 Months | 389 (8.4) | 75 (34.4) | 16 |
| >24 Months | 3073 (66.2) | 111 (50.9) | 24 |
| Missing 1176(25.4) | |||
| Literacy status of women | |||
| Illiterate | 3685 (79.5) | 174 (80.0) | 38 |
| Literate | 953 (20.5) | 44 (20.0) | 9 |
| Religion | |||
| Orthodox | 3831(82.6) | 175(80.3) | 38 |
| Muslim | 801(17.3) | 43(19.7) | 9 |
| Types of toilet facility | |||
| Have toilet | 118 (2.5) | 1 (0.5) | - |
| Have not toilet | 4520 (97.4) | 217 (99.5) | 47 |
| Listening to radio | |||
| No | 3737 (80.6) | 170 (78.0) | 37 |
| Yes | 879 (19.4) | 48 (22.0) | 10 |
| Wealth index | |||
| Poor | 1852(39.9) | 87(39.9) | 19 |
| Middle | 1160(25) | 54(24.7) | 12 |
| Rich | 1626(35.1) | 77(35.4) | 16 |
| Partner literacy | |||
| Illiterate | 3148(67.9) | 156(71.6) | 34 |
| Literate | 1490(32.1) | 62(28.4) | 13 |
| Contraceptive use | |||
| Yes | 1807(39) | 84(39) | 18 |
| No | 2831(61) | 134(61) | 29 |
| Marital status | |||
| Single | 466(10.1) | 25(11.5) | 5 |
| Married | 4172(89.9) | 193(88.5) | 42 |
| Smoking Cigarette | |||
| Yes | 9(0.2) | 1 | - |
| No | 4629(99.8) | 217(99.5) | 47 |
| Source of drinkingwater | |||
| Safe water | 2502(53.9) | 105(48.1) | 23 |
| Unsafe water | 2136(46.1) | 113(51.9) | 24 |
Demographic and socioeconomic factor
Maternal age: Neonates born to mothers aged less than 29 years have a lower risk of death compared to those aged 30 years and above.
Marital status: Most of the respondents were married or in relationships. 89.9% of neonatal deaths are recorded for married women, compared to single women.
Sex of child: The neonatal mortality rate was significantly higher in male infants (30 per 1000 live births) compared to their female counterparts (17). The sex ratio (male to a female) for live birth was 1:1.
Preceding birth interval: Mothers with shorter birth intervals after the previous birth have significantly higher neonatal deaths (36 per 1000 live births) than those with longer birth intervals. This is because babies born after a short interval are at a higher risk of mortality for the child born after the short interval.
Birth interval succeeding: Children with a succeeding birth interval of lesser than 24 months (24 per 1000 live births) had a higher risk of dying in the neonatal period, compared to those who gave birth greater than 24 months (16 per 1000 live births).
Maternal education: While only 20.5% of respondents can read and write, the majority (79.5%) can’t read and write. According to this responder, women who are illiterate have a greater rate of newborn mortality (38 per 1000 live births) than women who are literate (9 per 1000 live birth).
Paternal education: About (67.9%) of respondents can’t read and write and about 32.1% read and write. Neonatal mortality is higher among partners who can’t read and write (34 per 1000) compared to women who can read and write (13 per 1000 live birth)
Place of residence: The neonatal mortality rate was higher among the rural residents at 45 per 1000 compared to their urban counterparts (2 per 1000 live birth).
Table 2: Bivariable Cox regression affecting socio-economic and demographic factors for neonatal mortality in Ahmara region, EDHS 2016.
| CI 95% | ||||||
|---|---|---|---|---|---|---|
| Variable | Censored | Died | CHR | Lower | Upper | P- Value |
| Maternal Age | ||||||
| 20-29 | 834 | 38 | ||||
| 30-39 | 1873 | 89 | 2.22 | 1.48 | 3.32 | 0.19* |
| 40-49 | 1713 | 91 | 1.22 | 0.92 | 1.61 | 0.03** |
| Sex of child | ||||||
| Male | 2197 | 137 | 1.67 | 1.271 | 2.20 | 0.00*** |
| Female | 2223 | 81 | ||||
| Birth intervalpreceding | ||||||
| <24 months | 314 | 51 | 1.79 | 1.32 | 2.44 | 0.00*** |
| >24 months | 2962 | 167 | ||||
| Succeeding birth interval | ||||||
| <24 month | 314 | 75 | 2.30 | 1.76 | 3.02 | 0.00*** |
| > 24 month | 2962 | 111 | ||||
| Birth order | ||||||
| 1stbirth order | 1110 | 50 | 0.25 | 0.17 | 0.37 | 0.00*** |
| 2ndbirth order | 910 | 46 | 0.35 | 0.23 | 0.52 | 0.00*** |
| 3rdbirth order | 734 | 29 | 0.35 | 0.22 | 0.54 | 0.00*** |
| 4thbirth order | 1666 | 93 | ||||
| Marital status | ||||||
| Single | 441 | 25 | 1.19 | 0.78 | 1.80 | 0.41 |
| Married | 3979 | 193 | ||||
| Literacy status ofwomen | ||||||
| Can’tread and write | 3511 | 174 | 1.01 | 0.73 | 1.41 | 0.92 |
| Readand write | 909 | 44 | ||||
| Literacy status of partner | ||||||
| Can’tread and write | 2992 | 156 | 0.79 | 0.59 | 1.06 | 0.12* |
| Readand write | 1428 | 62 | ||||
| Religion | ||||||
| Orthodox | 3656 | 175 | 1.12 | 0.80 | 1.56 | 0.49 |
| Muslim | 764 | 43 | ||||
| Type of place of residence | ||||||
| Urban | 364 | 8 | 0.42 | 0.21 | 0.86 | 0.01** |
| Rural | 4056 | 210 | ||||
| Wealth index | ||||||
| Poor | 1765 | 85 | 1.23 | 0.91 | 1.68 | 0.17* |
| Middle | 1106 | 54 | 1.01 | 0.71 | 1.43 | 0.93 |
| Rich | 1549 | 77 | ||||
| Contraceptive use | ||||||
| No | 2697 | 134 | 1.23 | 0.93 | 1.63 | 0.13* |
| Yes | 1723 | 84 | ||||
| Smoking Cigarette | ||||||
| Yes | 8 | 1 | 4.24 | 0.59 | 30.34 | 0.15* |
| NoRC | 4412 | 217 | ||||
| Source of drinking water | ||||||
| Safewater | 2397 | 105 | 1.169 | 0.89 | 1.52 | 0.24* |
| Unsafewater | 2023 | 113 | ||||
| Types of toilet facilitys | ||||||
| Have toilet | 117 | 1 | 4.57 | 0.64 | 32.59 | 0.13* |
| Have not toilet | 4303 | 217 | ||||
| Listening to radio | ||||||
| No | 3567 | 170 | 0.86 | 0.63 | 1.19 | 0.38 |
| Yes | 831 | 48 | ||||
* = (P < 0.25) significant ** = (P < 0.05) significant *** = (P < 0.0001) significant
Wealth status: The neonatal mortality for poor households is 19 per 1000 live birth compared to middle-income households which are 12 per 1000 live birth and for rich households 16 per 1000 live births.
Contraceptive use: About 61% percent of women are not using any type of contraceptive the neonatal death is higher in this group is 29 per 1000 than those who use any type of contraceptive 18 per 1000.

Kaplan-Meir survival analysis shows the pattern of neonatal death in 28 days
The risk of dying within the first 28 days of life was highest in the 1st week and decrease sharply middle of the second week of life and then remains low over the late neonatal period. Figure 1 shows the daily risk of neonatal mortality over time.
Demographic and socioeconomic factors determining neonatal mortality
According to the bivariable Cox regression analysis (presented in table 2), the sex of the child, place of residence, preceding birth interval, succeeding birth interval, birth order, literacy status of the partner, wealth index, source of drinking water, types of toilet facilities, use of contraceptives, smoking, and maternal age group are candidates for the multivariable Cox regression analysis model and showed significant associations with neonatal morality (p < 0.2). The multivariable Cox regression model examines these factors in further detail (shown in table 3). Other predictors are not related in the bivariable Cox regression analysis.
Table 3 shows multivariable Cox regression analysis findings reveal the net effects of socioeconomic and demographic factors on newborn mortality while accounting for all other factors in the model. Neonatal mortality is significantly influenced by the child’s gender, the birth order, the birth intervals preceding and succeeding, type of place of residence, maternal age and the wealth index.
Table 3: Multivariable Cox regression affecting socio-economic and demographic factors for neonatal mortality in Ahmara region, EDHS 2016.
| CI 95% | ||||||||
|---|---|---|---|---|---|---|---|---|
| Variable | Censored | Died | CHR | P- Value | AHR | Lower | Upper | P- Value |
| Maternal Age | ||||||||
| 20-29 | 834 | 38 | ||||||
| 30-39 | 1873 | 89 | 2.22 | 0.00 | 2.75 | 1.78 | 4.26 | 0.00*** |
| 40-49 | 1713 | 91 | 0.69 | 0..15 | 1.34 | 1.10 | 1.81 | 0.04*** |
| Sex of child | ||||||||
| Male | 2197 | 137 | 1.67 | 0.00 | 0.60 | .443 | 0.83 | 0.00*** |
| Female | 2223 | 81 | ||||||
| Birth intervalpreceding | ||||||||
| <24 months | 314 | 51 | 1.79 | 0.00 | 0.70 | .515 | 0.96 | 0.03** |
| > 24 months | 2962 | 167 | ||||||
| Succeeding birth interval | ||||||||
| < 24 month | 314 | 75 | 2.30 | 0.00 | 0.45 | .326 | 0.62 | 0.00*** |
| > 24 month | 2962 | 111 | ||||||
| Birth order | ||||||||
| 1st birth order | 1110 | 50 | 0.252 | 0.00 | 0.19 | .128 | 0.29 | 0.00*** |
| 2nd birth order | 910 | 46 | 0.353 | 0.00 | 0.27 | .175 | 0.41 | 0.00*** |
| 3rd birth order | 734 | 29 | 0.351 | 0.00 | 0.81 | 0.73 | 1.41 | 0.92 |
| 4th birth order and above | 1666 | 93 | 0.460 | 0.00 | ||||
| Type of place of residence | ||||||||
| Urban | 364 | 8 | 0.42 | 0.01 | 1.33 | .862 | 4.140 | 0.04** |
| Rural | 4056 | 210 | ||||||
| Wealth index | ||||||||
| Poor | 1765 | 85 | 1.23 | 0.10 | 0.87 | .580 | 1.314 | 0.04** |
| Middle | 1106 | 54 | 1.01 | 0.93 | 0.75 | .496 | 1.142 | 0.18 |
| Rich | 1149 | 77 | ||||||
** = (P < 0.05) significant
*** = (P < 0.0001) significant
Gender characteristics of neonates had a significant impact on neonatal mortality with girls having 40% less risk of mortality as compared to boys (aHR = 0.60, 95% CI: 0.44-0.83). Preceding birth interval had a statistically significant effect on the risk of neonatal mortality (Likelihood ratio p-value < 0.05). Neonates whose mothers had a preceding birth interval greater than 24 months had 30% less risk of mortality than birth interval of fewer than 24 months (aHR = 0.70, 95% CI: 0.51-0.96). The succeeding birth interval had a statistically significant effect on the risk of neonatal mortality (Likelihood ratio p-value < 0.001) in the model. Neonates whose mothers had a succeeding birth interval greater than 24 months had 45% less risk of mortality as compared to neonates whose mothers succeeding a birth interval less than 24 months (aHR = 0.45, 95% CI: 0.32-0.62). Mothers aged 20-29 years did not have a higher hazard for neonatal mortality than mothers aged 30-39 years (aHR = 2.75, 95% CI: 1.78-4.26); and also the risk for mothers aged 40-49 years were strongly associated with increasing neonatal mortality (aHR = 1.34, 95% CI: 1.10-1.81). Neonates who reside in rural had a 43% excess risk of mortality as compared to neonates who reside in urban, and the hazard of NM was 1.43 higher among neonates born to rural resident women than their urban resident counterparts (aHR = 1.43, 95% CI: 0.86-4.14).
There was no significant association between contraceptive use, smoking cigarettes, source of drinking water, toilet facility, partner literacy status and wealth index, and neonatal death of the respondent in this study (P > 0.05).
Discussion
Using information from the 2016 Ethiopia Demographic and Health Survey, this study set out to determine the socioeconomic and demographic factors that influence newborn death in the Amhara region. Neonatal deaths in the Amhara region were found to be significantly influenced by birth intervals preceding and succeeding, place of residency, birth order, sex of the child, and wealth index, according to the results of the Cox regression model.
According to this study, male children have a higher neonatal mortality rate as compared to female children. About 60% at risk of mortality or 0.6 times more male neonates had higher hazard of death compared to female neonates, which agrees with previous findings from studies conducted in northern Ethiopia [7]. Female neonates were found to have a lower risk of death than their male counterparts this was consistent with studies reported in Indonesia [8,9] and Nigeria. This might be because there are genetic and biological disparities between the sexes, with boys having a weaker body and being prone to illness and mortality [10]. Maternal age of greater than 39 years carried a 66 % excess risk of neonatal mortality compared with maternal age of 20-29 years and age group 30-39 have 22% risk of mortality than age group 20-29 years, previous studies reported similar findings in Ethiopia [11], In Nepal among newborn greeter neonatal mortality to mothers in the young and old age category.
The results of this study also show that neonatal mortality rates decrease as the length of the previous birth interval increases. The newborn mortality is about 36 deaths per 1,000 live births for newborn babies less than 24 months after the birth of the preceding child. Neonates born less than 24 months after a previous birth are about 70% at risk of mortality or 0.70 times more hazard to died in their neonatal period than children born after 24 months or more from the preceding birth. This study’s findings are agreeing with previous studies done in Ethiopia, which show a relationship between short birth intervals and increased neonatal mortality risk [11], this finding is also the same as a study done in Nigeria. The categories of shorter birth intervals < 24 months used in this present study were in line with the WHO definition and the same as those used in previous studies (ie, ranges from < 18 to 24 months). Furthermore, the preceding birth interval also shows that the neonatal mortality rate decrease as the length of the succeeding births interval increase. Neonates born less than 24 months after a previous birth are about 45% at risk of mortality or 0.45 times more hazard to died in their neonatal period than children born after 24 months or more from the previous birth. This study is agreeing with an earlier study in Ethiopia [12]. However, in contrast to previous findings, our analyses found that long succeeding birth intervals have lower odds of mortality. In this study, the neonatal mortality rate is the highest for first births and fourth and above birth orders. The lowest newborn mortality rate is 6 deaths per 1,000 at birth order 3. But the death rate goes up for birth orders 4 and above, the rates for which are 20 deaths per 1,000. The first and very high-order births have elevated mortality rates this is similar to a previous study done in Ethiopia first to fourth birth order higher risk of neonatal mortality also this is similar to study in India which shows that although both first- and last-born newborn are at a significantly greater risk of dying compared with those in the middle, last-borne (i.e., fourth and higher order births) are at the worst risk. However, firstborns are less vulnerable in the post-natal phase, but the risk rises rapidly with each subsequent delivery, and the last born is at even greater risk than those in the neonatal period [13].
Place of residence had a significant influence on neonatal mortality in Amhara region. The result of this study showed that neonates born to mothers residing in rural places had higher odds of neonatal mortality compared to neonates born to mothers living in urban. The result is in line with some previous studies done in Ethiopia. Moreover, In this study the Cox regression analysis found an inverse association with the wealth status of the household significantly more likely to have neonatal death. The wealth index was one of the crucial factors linked to newborn death. A low household wealth index was related to a greater newborn mortality rate. Poor nutrition and difficulty receiving health treatments could underlie the likely response [14]. Neonates born into high-income households would be able to meet demands for services such as health care, quality of life, water quality, and better sanitation provision. These findings were consistent with prior research done in the Afar region of Ethiopia that found a lower wealth quintile to be associated with newborn deaths.
Conclusion
The main objective of this study was to identify the determinants of neonatal mortality in Amhara regional state based on the EDHS 2016 data set with the application of a Kaplan Meier survival analysis and Cox regression model. The study was based on secondary data obtained from the DHS program open source. For this study, the Cox regression model was the most appropriate than logistic regression. This result suggested that the Cox regression model is most suitable to deal with survival analysis. The prevalence of neonatal mortality in the Amhara region was higher (4.7%). In this study, the determinants for neonatal mortality were preceding birth interval, succeeding birth interval, place of residence, sex of child, mother age, and wealth index.
Recommendation: Based on the finding of this study, the following recommendations are forwarded:
• The regional and federal health bureau needs to strengthen community-oriented promotion of basic newborn care practices, including health extension workers, skilled birth attendants, and women’s participation in maternal health.
• Strengthening public health efforts to expand health education programs to educate mothers about the benefit of birth interval and birth order to reduce neonatal mortality
• In addition, place of residence is the factor to cause neonatal mortality, so the regional government should focus on training local rural healthcare workers and traditional midwives, promoting home-based neonatal care, and creating community awareness and community mobilization to reduce neonatal mortality.
• With free medical facilities for poor individuals, modern health care services should primarily be offered in rural locations.
Declarations
I hereby declare that this MSc thesis on “Determinant of Neonatal Mortality in Amhara Regional State, Ethiopia: Further Analysis of EDHS 2016” is my original work and has not been presented for a degree in any other university, and all sources of material used for this thesis on the determinant of neonatal mortality have been duly acknowledged.
Acknowledgment: I would first and foremost like to thank the almighty God for being on my side in the efforts toward the successful completion of my graduate study. My special gratitude to Yibeltal Tebekaw (PHD) for his continuous encouragement, guidance, and correspondence up to the completion of this work. I thank all those, who have influenced this work and who in one way or another have contributed to the success of my studies with their kindness and constructive advice. Finally, I would like to express my deepest gratitude to the center for population studies college of developmental studies Addis Ababa University.
References
- UNICEF. Neonatal Mortality. https://data.unicef.org/topic/child-survival/neonatal-mortality/). 2020.
- WHO. Newborns: Improving survival and well-being. https://www.who.int/news-room/fact-sheets/detail/newborns-reducing-mortality. 2020.
- WHS-WHO . World Health Statistics 2016: Monitoring Health for the SDGs Sustainable Development Goals. Available from: apps.who.int/iris/bitstream/10665/206498/1/9789241565264_eng.pdf. 2016.
- UN. Sustainable Development Goals. http://www.un.org/sustainabledevelopment/health/. 2019.
- UNICEF. Monitoring the situation of children and women, neonatal mortality. https://data.unicef.org/topic/child- survival/neonatal-mortality. 2018.
- CSA and ICF International. Ethiopia Demographic and Health Survey: key indicators report. Ethiopia, and Rockville, Maryland, USA CSA and ICF: Addis Ababa. 2016.
- Worke M, Mekonnen A, Limenh S. Incidence and determinants of neonatal mortality in the first three days of delivery in northwestern Ethiopia: A prospective cohort study. BMC Pregnancy Childbirth. 2021; 21: 647.
- Titaley CR, Dibley MJ, Robert CL. Determinants of neonatal in indonesia. BMC public health. 2008.
- Adewuyi EO, Lamichhane R, zaho y. Socioeconomic, bio-demographic and health/behavioral determinants of neonatal mortality in Nigeria: A multilevel analysis of 2013 demographic and health survey. 2013.
- Dairo OK. Factors affecting the utilization of antenatal care services in Ibadan, Nigeria. 2014.
- Mekonnen YB. Neonatal mortality in Ethiopia: Trends and determinants. BMC Public Health. 2013; 13: 483.
- Basha G, Woya A, Tekile A. Determinants of neonatal mortality in Ethiopia: an analysis of the 2016 Ethiopia Demographic and Health Survey. African Health Sciences. 2020.
- Mishra SK, Bali R, Signh A, Yadav A, et al. Birth Order, Stage Of Infancy And Infant Mortality In India. Published Online By Cambridge University Press. 2017.
- Yirgu R, Molla, M, Sibley L. Determinants of neonatal mortality in rural Northern Ethiopia: A population based nested case control study. 2017.