
Journal of Clinical Images and Medical Case Reports
ISSN 2766-7820
Research Article - Open Access, Volume 4
Differentiation of tuberculous spondylitis from brucellar spondylitis by changes seen on computed tomography
Qinpeng Xu1; Xingzhi Jing1; Meimei Zheng2; Jianmin Sun1; Xingang Cui1; Xiaoyang Liu1*
1Department of Spine Surgery, Shandong Provincial Hospital Affiliated to Shandong First Medical University, 9677 Jingshi Road, Jinan City, China.
2Department of Neurology, The First Affiliated Hospital of Shandong First Medical University, 16766 Jingshi Road, Jinan City, China.
Qinpeng Xu and Xingzhi Jing Contributed Equally to this Study
*Corresponding Author : Xiaoyang Liu
Department of Spine Surgery, Shandong Provincial Hospital Affiliated to Shandong First Medical University, 9677 Jingshi Road, Jinan City, China.
Tel: 86-531 6877 3207 & 86-531 6877 3209;
Email: liuxiaoyang@sdfmu.edu.cn
Received : Aug 27, 2023
Accepted : Sep 15, 2023
Published : Sep 22, 2023
Archived : www.jcimcr.org
Copyright : © Liu X (2023).
Abstract
Background: Tuberculous Spondylitis (TS) and Brucellar Spondylitis (BS) both cause major long-term morbidity and disability but are difficult to differentiate. This study aimed to identify Computed Tomography (CT) features of diagnostic value in differentiating Tuberculous Spondylitis (TS) from Brucellar Spondylitis (BS).
Methods: In this retrospective study, we analyzed 82 consecutive patients seen at our hospital from December 2012 to January 2019 with confirmed TS or BS. CT examination was performed in 42 patients with TS and 40 with BS. Information on bone destruction and formation, vertebral wall integrity, osteosclerosis, and sequestrum was collected and compared using the chi-square test or t-test. P< 0.01 was considered statistically significant.
Results: Bone destruction was greater in the TS group than in the BS group (468.03 mm2 vs. 301.60 mm2, t=6.77, P< 0.001), preferentially involving each third of the vertebral body horizontally (39.7% vs. 16.8%, χ2=48.50, P < 0.001; Positive Predictive Value [PPV]=80.6%) and the area under the end plate and equatorial portion of the vertebra longitudinally (78.83% vs. 30.84%, χ2=82.66, P< 0.001, PPV=81.87%). The BS group was more likely to show fan-shaped osteosclerosis (12.22% vs. 0.79%, χ2=44.34, P< 0.001; PPV=92.31%), longer bone formation surrounding the vertebra (15.41 mm vs. 2.45 mm, t=3.63, P< 0.001), and longer anterior bone formation (5.46 mm vs. 3.97 mm, t=3.88, P< 0.001). Anterior and closed bone formation was more common in the BS group than in the TS group (47.66% vs. 7.41%, χ2=122.61, P< 0.001; PPV=78.46%). Fragmented and blocked sequestrum was more common in the TS group than in the BS group and tended to spread in and out of the erosions (44.44% vs. 0.93%, χ2=68.27, P< 0.001, PPV=98.82%).
Conclusions: TS and BS show specific features of bone destruction, bone formation, and sequestrum on CT imaging. Our findings imply that bony changes can help clinicians differentiate between these two spinal infections.
Abbreviations: TB: Tuberculosis; TS: Tuberculous Spondylitis; BS: Brucellar Spondylitis; CT: Computed Tomography; MRI: Magnetic Resonance Imaging; STA: Standard Tube Agglutination; PPV: Positive Predictive Value; ROC curve: Receiver-Operating Characteristic curve.
Citation: Xu Q, Jing X, Zheng M, Sun J, Liu X, et al. Differentiation of tuberculous spondylitis from brucellar spondylitis by changes seen on computed tomography. J Clin Images Med Case Rep. 2023; 4(9): 2608.
Background
Tuberculosis (TB) is a leading cause of morbidity and mortality worldwide [1]. In 2017, there were an estimated 10 million incident TB cases and 1.6 million deaths from TB globally [2]. Tubercular Spondylitis (TS) is the most common form of musculoskeletal TB and accounts for approximately 20% of cases [3]. Rates of long-term TS-related morbidity and disability are increasing, especially in developing countries [4].
Brucellosis, caused by the brucella bacterium, remains a major health problem in many parts of the world [5]. However, prompt diagnosis of Brucellar Spondylitis (BS) remains difficult because the clinical findings are nonspecific.
TS and BS are both common spinal infections and share several clinical manifestations (back pain, fever, and elevated inflammatory markers), which makes it difficult to distinguish between these entities [6]. Although biopsy and culture is the diagnostic gold standard for infectious diseases, the positivity rates are low for both these types of bacteria, being reportedly less than 50% for TS [7] and approximately 32% for BS [8]. A next-generation Xpert MTB/RIF assay was reported to have better detection rates for mycobacterium in spinal specimens [9]. However, the diagnostic value of this assay is limited by the inconvenience of obtaining necessary biopsy specimens in patients with infections. Therefore, there is an urgent need for another method of early diagnoses.
With the rapid development and increasing popularity of imaging techniques, there is increasing interest in identification of specific radiological features of TS and BS [10-12]. Magnetic Resonance Imaging (MRI) is the preferred modality for the diagnosis and assessment of TS [13]. However, despite much research on spinal infections, no satisfactory strategy has been established for the differentiation of MRI in TS and BS.
CT is preferred for the early diagnosis of pulmonary TB [14]. A previous report described CT imaging characteristics that help to differentiate pyogenic spondylitis from BS [15], identifying the value of changes seen on CT in differentiating these spinal infections. In this study, we sought to identify distinguishing features of TS and BS on CT images in order to help clinicians promptly differentiate these two spinal infections.
Materials and methods
Patients
This retrospective study was approved by our institutional ethics committee. Informed consent was obtained from all study participants. The study population was comprised of 82 consecutive patients from our hospital in eastern China with a confirmed diagnosis of TS or BS in the period from December 2012 to January 2019. All study participants consented to conventional spinal CT examination before receiving treatment and were followed up until resolution of symptoms. The minimum follow-up duration was 6 months.
Diagnosis of TS was established by clinical, laboratory, imaging, and pathological examinations [12,16]. Pathological evidence of TB, including bacterial growth in biopsy specimens, caseating granulomatosis on histopathology, and the presence of acid-fast bacilli on Ziehl-Neelsen-stained slides, was considered the gold standard for diagnosis.
BS was diagnosed based on clinical symptoms and signs compatible with the disease (back pain, fever, sweats, fatigue, hepatosplenomegaly) and the presence of specific antibodies at significant titers (Standard Tube Agglutination [STA] test for brucella ≥1/100) and/or isolation of brucella species in blood or biopsy specimens [17]. Other criteria included a duration of more than 1 year of STA testing for brucella ≥1/50 and infection in the vertebra or intervertebral disc on MRI.
The exclusion criteria were proven pyogenic infection of the spine, postoperative spinal infection, and no or incomplete information on the disease course.
CT imaging
A 64-row MDCT scanner (mostly using the Somatom Sensation Cardiac, Siemens Healthineers; some using the Aquilion 64, Toshiba or Light Speed 64, GE) was used for the radiological examinations. Parameters were set at 120 kVp or 140 kVp with a tube load of 180-310 mAs depending on patient weight and size. Coronal, sagittal, and axial reformations with a 2 mm section thickness were created from the primary source data. The CT images were reviewed by two blinded musculoskeletal radiologists, each with more than 10 years of experience. Any disagreements were resolved by consensus.
Imaging evaluation
The anatomic vertebral and disc heights were measured on midsagittal images. The dimensions and locations of maximal erosion and bone formation were measured on sagittal images showing maximal erosion and on axial images adjacent to the endplate cortex. Bone destruction was categorized into 10 types in the same manner as in our previous study [15]. Extensive destruction was defined as involvement of each third of the vertebral body horizontally. Longitudinal location of erosion was categorized into five types (none, endplate, area under the endplate, equatorial portion of vertebra, and both the area under the endplate and the equatorial portion of the vertebra). The rate of loss of height was calculated as the height of the destroyed vertebra divided by the original vertebral height. The length and location of the destroyed vertebral wall were recorded on axial images. The length, width, and location of paraspinal bone formation were also assessed on both axial and sagittal images. Anterior bone formation was classified into five types (none, dotted, parallel, open, or closed) [15]. Axial location of sequestrum was divided into three types (none, in the erosions, in and out of the erosions). The morphological presentation of sequestrum was categorized as none, dotted, linear, fragmented, and blocked.
Statistical analysis
The normality of the data distribution was assessed using the Shapiro–Wilk test. Pearson’s chi-square test was used for the categorical data. Continuous variables were compared using the independent samples t-test. Receiver-Operating Characteristic (ROC) curves were used to evaluate the diagnostic value and to select optimum cut-off values. The Positive Predictive Values (PPVs) of specific imaging features for detection of TS or BS were calculated. All statistical analyses were performed using SPSS software (version 22; IBM Corp., Armonk, NY, USA). A two-sided P-value< 0.01 was considered statistically significant.
Results
Forty-two patients with TS (19 men, 23 women; mean age 57 [range, 17-67] years) and 40 with BS (27 men, 13 women; mean age 53 [range, 29-74] years) were included in the study. Detailed information on patient demographics and clinical characteristics is provided in Table 1. No significant difference was found in the sex distribution and age at onset. The mean interval between presentation and CT imaging was 7.10 and 4.48 months in the TS and PS group, respectively, which was not statistically different. There was no statistical difference for the mean duration between presentation and confirmed diagnosis between the two groups. Most patients were cured through drug therapy. Four patients from the TS group and 2 patients from the BS group accepted decompression and internal fixation procedure because of neurological deficit.
The TS group included cervical (n=3), thoracic (n=11), thoracolumbar (n=9), and lumbar (n=19) cases. A total of 117 vertebrae were infected, and the mean number of involved vertebrae was 2.79 per patient. More than four vertebrae were involved in three patients, one of whom had involvement of nine vertebrae.
The BS group consisted of cervical (n=1), thoracic (n=2), thoracolumbar (n=4), and lumbar (n=33) cases. The lumbar spine was the site most commonly infected. Ninety-eight vertebrae were infected. The average number of destroyed vertebrae was 2.45 per patient. No patient had involvement of more than four vertebrae.
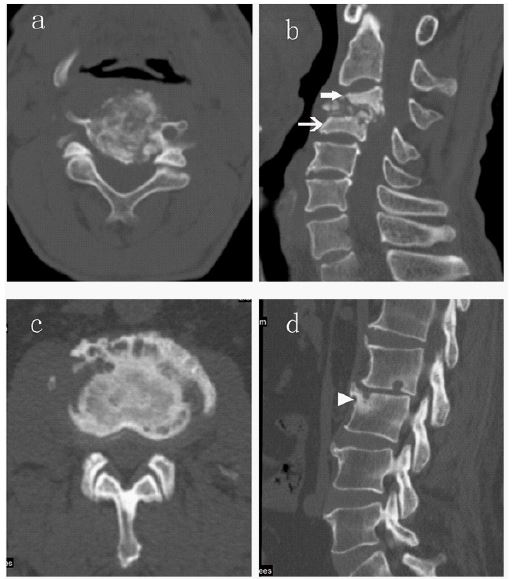
Information on bone destruction and its diagnostic significance is provided in Table 2. The sagittal and coronal diameters of erosion were significantly greater in the TS group than in the BS group (16.49 mm vs. 12.32 mm, P< 0.001 and 21.50 vs. 16.66, P< 0.001, respectively); similarly, the area destroyed and the destruction rate were greater in the TS group (468.03 mm2 vs. 301.60 mm2, P< 0.001 and 39.83% vs. 18.11%, P=0.001). The PPV of a destruction rate of more than 0.42 for detection of TS was 89.88%. Different morphologies of bone destruction on axial images were observed between the two groups (Figure 1). Extensive destruction was more common in the TS group than in the BS group (39.71% vs. 16.80%, χ2=48.50, P< 0.001) with a PPV for detection of TS of 80.6% (Figure 2a). The posterior appendix (pedicle, lamina, facet, transverse process, and spinous process) and peripheral bone (vertebral body except in the center and in the vertebral wall) were destroyed more often in the BS group. The rate of loss of vertebral height was greater in the TS group (47.23% vs. 12.96%, P< 0.001) with a PPV of more than 0.37 for detecting TS in 92.95% of cases. Erosions in the TS group commonly involved the area under the endplate and equatorial portion of the vertebra (Figure 2b), whereas the endplate and area under the endplate were more easily destroyed in the BS group (78.83% vs. 30.84%, χ2=82.66, P< 0.001, PPV=81.87%, Figure 2d, Figure 3).
Although there was no statistically significant difference in sagittal or coronal osteosclerosis (10.13 vs. 11.62, P=0.20 and 14.58 vs. 12.21, P=0.10, respectively), more osteosclerosis was present throughout the vertebra in the TS group than in the BS group (32.27% vs. 11.21%, χ2=16.31, P< 0.001, PPV=83.56%; Figure 2b). By contrast, fan-shaped osteosclerosis around erosions, especially those at the anterior edge of the superior or inferior endplate, had good diagnostic value, favoring a diagnosis of BS (12.22% vs. 0.79%, χ2=44.34, P< 0.001, PPV=92.31%; Figure 2d).
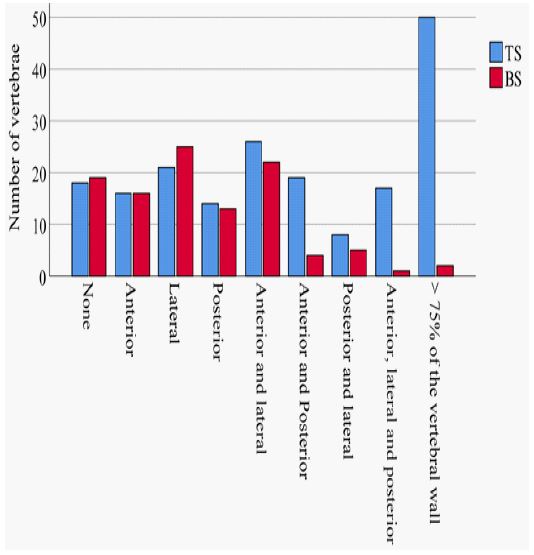
No statistically significant between-group difference was observed in the integrity of the vertebral wall (10.58% for TS vs. 17.76% for BS, χ2=3.08, P=0.08). However, the length and rate of destruction were significantly greater in the TS group than in the BS group (52.89 mm vs. 30.86 mm, t=5.70, P< 0.001 and 45.89% vs. 20.96%, t=6.74, P< 0.001, respectively). A vertebral wall destruction rate of greater than 34.43% favored a diagnosis of TS and had a PPV of 87.11%. A difference was also observed in the location of the vertebral wall destruction (χ2=50.94, P< 0.001; Figure 4) in that destruction of the lateral portion of the vertebral wall was more common in the BS group (26.53% vs. 17.95%) and destruction involving the anterior, lateral, and posterior walls was more common in the TS group (8.99% vs. 0.93%).
The proportion of bone formation around the vertebra was greater in the BS group than in the TS group (65.42% vs. 7.41%, χ2=113.13, P< 0.001; PPV=83.33%). The BS group showed significantly longer bone formation than the TS group (15.41 mm vs. 2.45 mm, t=3.63, P< 0.001). Bone formation longer than 6.94 mm around the vertebra favored a diagnosis of BS (PPV=90.69%). Anterior bone formation was longer and had a more closed morphological presentation in the BS group than in the TS group (5.46 mm vs. 3.97 mm, t=3.88, P< 0.000 and 47.66% vs. 7.41%, χ2=122.61, P< 0.001; PPV=78.46%, respectively; Figure 5).
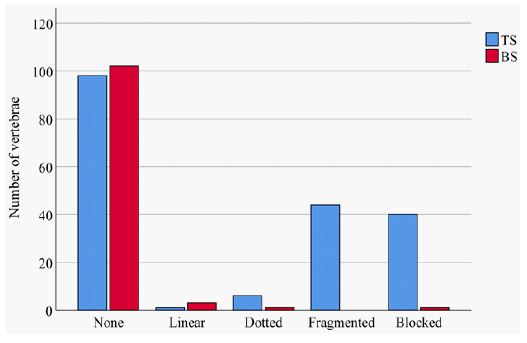
Sequestrum was more common in the TS group than in the BS group (47.62% vs. 3.74%, χ2=60.70, P< 0.001, PPV=95.74%). Sequestrum was located both in and out of the erosions in the TS group but only appeared in the erosions in the BS group. There was also a significant between-group difference in the shape and size of sequestrum; fragmented and blocked sequestrum were more common in the TS group (χ2=68.27, P< 0.001, 21.16% vs. 0.93%, PPV=97.56% and 23.28% vs. 0.00%, PPV=100%, respectively), whereas the BS group showed only dotted and linear sequestrum (Figure 6).
Table 1: The basic clinical data.
| TSgroup | BSgroup | |
|---|---|---|
| No.of patients | 42 | 40 |
| Male | 19 | 27 |
| Female | 23 | 13 |
| Age | 57(17-67) | 53(29-74) |
| Fever | 12 | 21 |
| Backpain | 36 | 38 |
| Neurologicaldeficiency | 15 | 9 |
| Levelof involvement | ||
| Cervical spine | 5 | 2 |
| Thoracic spine | 56 | 20 |
| Lumbar spine | 49 | 70 |
| Sacral spine | 4 | 6 |
| No.of involved vertebrae | 117 | 98 |
| MeanNo. of involved vertebrae | 2.79 | 2.45 |
Table 2: Bone destruction and its diagnostic significance.
| TS | BS | t | P | AUC | Cut-off | PPV | ||
|---|---|---|---|---|---|---|---|---|
| Sagittal vertebral diameter | ||||||||
| Intrinsic | 30.70±6.75 | 35.77±5.06 | ||||||
| Destructed | 16.49±9.78 | 12.32±8.56 | 3.97 | <0.001 | 0.63 | 15.18 | 0.79 | |
| Rate | 0.53±0.28 | 0.35±0.24 | 6.26 | <0.001 | 0.70 | 0.42 | 0.79 | |
| Area of vertebra | ||||||||
| Intrinsic | 1179.44±483.31 | 1648.25±396.86 | ||||||
| Destructed | 468.03±421.90 | 301.60±307.51 | 4.01 | <0.001 | 0.62 | 474.00 | 0.78 | |
| Rate | 0.40±0.30 | 0.18±0.17 | 8.27 | <0.001 | 0.73 | 0.42 | 0.90 | |
| Hight of vertebra | ||||||||
| Intrinsic | 16.59±8.41 | 21.89±10.70 | ||||||
| Destructed | 8.26±7.28 | 3.18±4.50 | 11.25 | <0.001 | 0.72 | 7.16 | 0.89 | |
| Rate | 0.47±0.33 | 0.13±0.18 | 3.46 | 0.001 | 0.81 | 0.37 | 0.93 | |
| Length of vertebra wall | ||||||||
| Intrinsic | 126.23±51.21 | 146.69±18.86 | ||||||
| Destructed | 52.89±39.65 | 30.86±28.46 | 5.70 | <0.001 | 0.66 | 37.06 | 0.80 | |
| Rate | 0.46±0.45 | 0.21±0.19 | 6.74 | <0.001 | 0.73 | 0.34 | 0.87 | |


Discussion
Both TS and BS continue to be public health problems, particularly in developing countries [18]. Several studies have identified radiological features that help to distinguish different types of infectious spondylitis [11,12,19,20]. However, the features of vertebral destruction cannot be detected clearly on MRI; they are often concealed by a hyperintense area of inflammatory edema. By contrast, CT imaging clearly reveals changes reflecting bone destruction and formation that have significance when differentiating spinal infections [15].
Though duration of illness varied from patient to patient in these two different chronic granulomatous infectious pathologies, no significant difference was found in the mean interval between presentation and CT imaging in the groups. Thus, specific changes of bony structures depend mainly on the spinal structures and bacterial characteristics. Mycobacterium tuberculosis enters the vertebra through the nutrient and metaphyseal arteries with coiled terminals, remains beneath the endplate, and forms multiple TB abscesses followed by caseous necrosis [21]. Lipids in mycobacteria inhibit the activity of macrophages and lysosomes such that multiple lesions cannot be absorbed and become aggravated and integrated into areas of extensive destruction. The mechanism of bone destruction could explain the pattern of extensive destruction in the TS group. Greater bone destruction with less ability to form bone results in extensive destruction involving the anterior, middle, and posterior portions of the vertebra horizontally and the areas under the endplate and the equatorial portion of the vertebra longitudinally.
The brucella organism is shorter than a mycobacterium and enters the vertebral periphery via the metaphyseal arteries and numerous tiny peripheral arteries; therefore, it can reach an area closer to the endplate than M. tuberculosis. In this study, erosions in the BS group were more commonly located in and beneath the endplate. Bone destruction in the BS group rarely involved the equatorial area of the vertebra. A characteristic manifestation of BS is an isolated erosion with an osteosclerotic margin located in the anterior or posterior edge of the endplate because of its rich blood supply [12,15]. Brucella can be easily engulfed by neutrophils and phagocytes and is less virulent than mycobacteria. This explains why bone formation was more preserved both inside and outside of the vertebra in the BS group than in the TS group.
Sequestrum is a well-recognized finding in musculoskeletal osteomyelitis [22,23]. A tubercular lesion is difficult to absorb, leading to multiple abscesses and bone destruction with sequestration of the remaining bone, resulting in fragmented and blocked sequestrum. TS is characterized by a form of sequestrum that includes round-shaped osteolysis, peripheral bone sclerosis, and central sequestrum [24]. By contrast, brucella produces invasive and proteolytic enzymes such that sequestrum is rare. Several patients in our study showed only dotted or linear sequestrum.
This study has several limitations. The first is that cases with rare features of spondylitis may not have been included because of the retrospective nature of the study and the small sample size drawn from one institution in eastern China. The second limitation is that we excluded patients with pyogenic spondylitis, which accounts for a large share of the burden of spondylitis. Therefore, more clinical studies are needed to identify imaging characteristics that have high sensitivity and specificity for differentiating between all the types of spondylitis.
Conclusion
In conclusion, TS is more likely to manifest as extensive vertebral destruction with more destruction of the vertebral wall and fragmented and blocked sequestrum. By contrast, BS manifests as more isolated erosions surrounded by fan-shaped osteosclerosis, more bone formation around the vertebra, and longer anterior and closed bone formation. Changes on CT imaging help to differentiate TS from BS and can make up for the shortcomings of other examinations.
Declarations
Data availability: The data used to support the findings of this study are included within the article.
Conflicts of interest: None.
Funding: None.
References
- Glaziou P, Floyd K, Raviglione MC. Global Epidemiology of Tuberculosis. Seminars in Respiratory and Critical Care Medicine. 2018; 39: 271-285.
- Macneil A, Glaziou P, Sismanidis C, Maloney S, Floyd K. Global Epidemiology Of Tuberculosis And Progress Toward Achieving Global Targets - 2017. Morbidity and Mortality Weekly Report. 2019; 68: 263-266.
- Polley P, Dunn R. Noncontiguous Spinal Tuberculosis: Incidence and Management. European Spine Journal. 2009; 18: 1096-1101.
- Jia CG, Gao JG, Liu FS, et al. Efficacy, Safety And Prognosis of Treating Neurological Deficits Caused by Spinal Tuberculosis Within 4 Weeks’ Standard Anti-Tuberculosis Treatment: A Single Medical Center’s Experience. Experimental and Therapeutic Medicine. 2020; 19: 519-526.
- Franc KA, Krecek RC, Hasler BN, Arenas-Gamboa AM. Brucellosis Remains a Neglected Disease in the Developing World: A Call For Interdisciplinary Action. Bmc Public Health. 2018; 18: 125.
- Turunc T, Demiroglu YZ, Uncu H, Colakoglu S, Arslan H. A Comparative Analysis of Tuberculous, Brucellar and Pyogenic Spontaneous Spondylodiscitis Patients. The Journal of Infection. 2007; 55: 158-163.
- Jeong S, Choi S, Youm J, Kim H, Ha H, et al. Microbiology and Epidemiology of Infectious Spinal Disease. Journal of Korean Neurosurgical Society. 2014; 56: 21-27.
- Yilmaz E, Parlak M, Akalin H, et al. Brucellar Spondylitis: Review of 25 Cases. Journal of Clinical Rheumatology: Practical Reports on Rheumatic & Musculoskeletal Diseases. 2004; 10: 300-307.
- Arockiaraj J, Michael JS, Amritanand R, David KS, Krishnan V. The Role of Xpert Mtb/Rif Assay in The Diagnosis of Tubercular Spondylodiscitis. European Spine Journal. 2017; 26: 3162-3169.
- Frel M, Białecki J, Wieczorek J, Paluch Ł, Dąbrowska-Thing A, et al. Magnetic Resonance Imaging In Differentatial Diagnosis Of Pyogenic Spondylodiscitis And Tuberculous Spondylodiscitis. Polish Journal of Radiology. 2017; 82: 71-87.
- Li T, Li W, Du Y, et al. Discrimination of Pyogenic Spondylitis from Brucellar Spondylitis on Mri. Medicine (Baltimore). 2018; 97: E11195.
- Gao M, Sun J, Jiang Z, et al. Comparison of Tuberculous And Brucellar Spondylitis on Magnetic Resonance Images. Spine. 2017; 42: 113-121.
- Zhang N, Zeng X, He L, et al. The Value of Mr Imaging in Comparative Analysis of Spinal Infection in Adults: Pyogenic Versus Tuberculous. World Neurosurgery. 2019; 128: E806-E813.
- Skoura E, Zumla A, Bomanji J. Imaging in Tuberculosis. International Journal of Infectious Diseases. 2015; 32: 87-93.
- Liu X, Zheng M, Jiang Z, et al. Computed Tomography Imaging Characteristics Help To Differentiate Pyogenic Spondylitis From Brucellar Spondylitis. European Spine Journal. 2020; 29: 1490-1498.
- Liu Z, Wang J, Chen G, et al. Clinical Characteristics Of 1378 Inpatients With Spinal Tuberculosis In General Hospitals In South-Central China. Biomed Research International. 2019; 2019: 9765253.
- Liang C, Wei W, Liang X, De E, Zheng B. Spinal Brucellosis in Hulunbuir, China, 2011-2016. Infection And Drug Resistance. 2019; 12: 1565-1571.
- Louw QA, Tawa N, Van Niekerk SM, Conradie T, Coetzee M. Spinal Tuberculosis: A Systematic Review Of Case Studies And Development Of An Evidence-Based Clinical Guidance Tool For Early Detection. Journal of Evaluation In Clinical Practice. 2019.
- Panta OB, Pathak YR, Karki DB. Magnetic Resonance Imaging Findings in Spondylodiscitis. J Nepal Health Res Counc. 2018; 15: 217-221.
- Foreman SC, Schwaiger BJ, Meyer B, et al. Computed Tomography And Magnetic Resonance Imaging Parameters Associated With Poor Clinical Outcome In Spondylodiscitis. World Neurosurgery. 2017; 104: 919-926.
- Ali A, Musbahi O, White V, Montgomery AS. Spinal Tuberculosis: A Literature Review. Jbjs Rev. 2019; 7: E9.
- Jennin F, Bousson V, Parlier C, Jomaah N, Khanine V, et al. Bony Sequestrum: A Radiologic Review. Skeletal Radiology. 2011; 40: 963-975.
- Shikhare SN, Singh DR, Shimpi TR, Peh WCG. Tuberculous Osteomyelitis and Spondylodiscitis. Seminars in Musculoskeletal Radiology. 2011; 15: 446-458.
- Ousehal A, Adil A, Abdelouafi A, Kadiri R. Centrosomatic Spinal Tuberculosis: Radiographic Features in 10 Cases. Journal of Neuroradiology. 2000; 27: 247-252.