
Journal of Clinical Images and Medical Case Reports
ISSN 2766-7820
Research Article - Open Access, Volume 5
Population pharmacokinetics of lumefantrine and its metabolite, desbutyl-lumefantrine, in children under five years of age with malaria
Norah Mwebaza1,2*; Urban Hellgren3,4; Francis W Ojara2; Lars L Gustafsson1; Antero V Silva5; Anton Pohanka1,5; Celestino Obua2; Paul Waako2; Ene I Ette6
1Department of Laboratory Medicine, Division of Clinical Pharmacology, Karolinska Institutet, Stockholm, Sweden.
2Department of Pharmacology & Therapeutics, School of Biomedical Sciences, Makerere University College of Health Sciences, Kampala, Uganda.
3Department of Infectious Diseases, Karolinska University Hospital, Stockholm, Sweden.
44Department of Medicine Huddinge, Unit of Infectious Diseases, Karolinska Institutet, Stockholm, Sweden.
5Department of Clinical Pharmacology, Karolinska University Hospital, Huddinge, Sweden.
6Anoixis Corporation, Natick, MA, USA.
*Corresponding Author : Norah Mwebaza
Department of Pharmacology & Therapeutics,
School of Biomedical Sciences, Makerere University
College of Health Sciences, Kampala, Uganda.
Email: mwebno@yahoo.com
Received : Feb 28, 2024
Accepted : Mar 18, 2024
Published : Mar 25, 2024
Archived : www.jcimcr.org
Copyright : © Mwebaza N (2024).
Abstract
We developed a population pharmacokinetic model to characterize the Pharmacokinetics (PK) of lumefantrine and its active metabolite, desbutyl-lumefantrine, in children under 5 years. Data were available from 55 children treated for uncomplicated falciparum malaria with standard 3-day Artemether- Lumefantrine (AL) regimen. Combined sparse and intense PK sampling strategy was used to obtain venous samples for 28 days. Using NONMEM, a two-compartment linear pharmacokinetic model incorporating lag time with first order absorption characterized the PK of lumefantrine. Desbutyl-lumefantrine PK was also characterized with a two compartment model. Inter-subject variability in apparent Clearance (CL/F) was explained by Body Mass Index (BMI) and age, while weight partially explained variability in apparent volume of distribution of the central compartment (V2/F). Ontogeny in CYP3A4, the isozyme metabolizing lumefantrine, was incorporated into the age component of lumefantrine CL/F model. Incorporation of BMI into CL/F model explained variability due to weight and stunting. For lumefantrine typical inter-compartment clearance (Q/F), CL/F, V2/F for a typical subject weighing 13.0 kg and BMI 16.62 kg/m2 , and apparent volume of distribution of peripheral compartment (V3/F) were 0.176 L/hr, 3.19 L/hr, 28.1 L, and 58.4 L, respectively. Lumefantrine CL/F was higher in children ≤2 year compared to those >2 years, notably decreased with increasing BMI (-1.10) and age from two to just less than five years (CL/FAGE: -0.423 (-0.648, -0.198)). Results indicate lumefantrine CL/F is a function of age and BMI. Our findings provide structural basis for future evaluation of rational AL dosing guidelines among under five year olds.
Keywords: Under 5 year olds; Desbutyl-lumefantrine; Lumefantrinel population pharmacokinetics; Ontogeny; BMI.
Citation: Mwebaza N, Hellgren U, Ojara FW, Gustafsson LL, Silva AV, et al. Population pharmacokinetics of lumefantrine and its metabolite, desbutyl-lumefantrine, in children under five years of age with malaria. J Clin Images Med Case Rep. 2024; 5(3): 2941.
Introduction
Malaria remains a major health problem in Africa especially among children <5 years of age [1]. Most cases are due to uncomplicated Plasmodium falciparum malaria (95%); if inappropriately treated might progress rapidly to severe disease [1]. Artemisinin-Based Combination Therapy (ACT) is recommended to optimize cure, reduce risk of resistance development and malaria transmission [1,2]. Artemether-Lumefantrine (AL) is a widely adopted as first-line ACT for uncomplicated malaria [1,3]. Lumefantrine, the long acting partner drug ensures cure by eliminating residual malaria parasites surviving clearance by the more potent short acting artemether and its metabolite. In addition lumefantrine provides post treatment prophylaxis [1,4-6].
Data on disposition is still sparse and the rationale for doses among children is still unclear. Physiological maturation may affect drug disposition [7-9]. Available reports indicate lower lumefantrine exposures and/or higher risk of treatment failure among children aged <5 years weighing <15 kg, suggesting sub-optimal doses with the current fixed weight-based AL treatment regimen [10-16]. Lumefantrine is mainly metabolized to N-desbutyl-lumefantrine by cytochrome P450 CYP3A4 [17,18]. However, the systemic exposure of desbutyl-lumefantrine is much lower than that of lumefantrine and may range between <1/100 to 1/10 [5,6,16-20]. Data suggest that desbutyl-lumefantrine is an active metabolite [16,20-23], with more potent anti-malarial activity than its parent compound [19,20]. This study was, therefore, undertaken to develop a model to characterize the PPK of lumefantrine and desbutyl-lumefantrine in the most vulnerable group, children under 5 years old.
Materials and methods
Ethical considerations
The study was approved by School of Medicine, Makerere University Research Ethics Committee (2009-054) and Uganda National Council of Science & Technology (HS 567) and registered at ClinicalTrials.gov (NCT01944189). Written informed consent was obtained from a parent or guardian.
Study design, and setting
A prospective PK study including a randomized bioavailability sub-study (nested) was conducted at the Department of Pharmacology & Therapeutics, Makerere University College of Health Sciences, within Mulago National Referral Hospital Complex, Kampala, Uganda. A combination of intense and sparse PK sampling design was employed to enable the description of the population PK of lumefantrine and desbutyl-lumefantrine among <5 year old children undergoing AL therapy for uncomplicated falciparum malaria. Intense samples were available from a sub-set of participants, who were co-enrolled in an open label, nested bioavailability study using a two stage block (by dose and food arm) randomized design. Detailed description of this nested bioavailability study has been reported elsewhere [24].
Study population
Children with uncomplicated malaria were eligible if aged between 6 months and <5 years; weighed between >5kg to 25 g; with a history of fever and microscopically confirmed P. falciparum monoinfection [25] and outpatients at departments of Mulago Hospital and surrounding public health facilities within 20 km radius. These are low transmission areas. Exclusion criteria included mixed plasmodium infections, complicated malaria, vomiting, hemoglobin <5 g/dl, reported use of ACTs in the past 7 days or past 28 days if lumefantrine was the partner drug; use of medication known to influence CYP450 3A4/5 enzymes, such as anticonvulsants (phenobarbitone, carbamazepine), ketoconazole, rifampicin, and anti-retroviral agents [1].
Study procedures and dosing
Upon enrollment, full clinical examination was done and blood (2 to 4 mL) was drawn for baseline lumefantrine and metabolite, malaria microscopy, parasite genotyping, blood chemistry, and for hematological parameters.
Standard care regimen was used. Current standard AL (tablet with fixed ratios of 1:6 {20 mg Artemether (A) and 120 mg Lumefantrine (L)} regimen is a fixed-weight-based dose, where subjects weighing 5 to <15 kg, 15 to <25 kg, >25 to <35 kg and ≥ 35 kg receive 1, 2, 3 or 4 tablets, respectively. The drug was administered on six occasions at the following times: 0, 8, 24, 36, 48 and 60 hours. Eligible children were dosed according to the above standard of care regimen with dispersible AL tablet (Dispersible Coartem®, Novartis Pharma AG, Basel, Switzerland). Thus thirty eight children weighed <15 kg therefore received 1 tablet and 17 weighed ≥15 and <25 kg received 2 tablets. Each dose was accompanied by a fatty meal. This included milk (n=38) (50 mL containing ≈1.7 g of fat /tablet) or maize porridge plus oil (50 mL containing ≈0.125 g of fat plus 1.5 mL of oil containing ≈1.5g of fat/tablet) for those (n=17) co-enrolled in the respective nested food intervention study arm [24]. Dosing was directly observed for the first dose and for at least one of the doses on subsequent dosing days. Parents/guardians were given the assigned dose, assigned food supplement and dosing instructions for the unsupervised dosing of the children (subjects) while at home.
Pharmacokinetic sampling
A mixed (combination of sparse and intense) sampling design was implemented in the study. Sparse samples (1 to 8, venous plasma 0.5 to 1 mL) were obtained after a baseline sample, at various times during the 28 day follow up period as follows:
All participants (N=55) routinely provided samples on day 0 (before the first dose) and after the last dose on days 3, 7, 14, 21 and 28.
From children co-enrolled in nested food intervention study (n=33), additional samples were available for the absorption phase. Intensive samples were obtained on Day 0, after the first dose at 1, 1.5, 2, 3, 4, 6, and 8 hours [24]. Actual times of dose administration and sample collection were recorded and used in the data analysis.
Lumefantrine and metabolite assay
Liquid Chromatography Tandem Mass Spectrometry (LCMS/ MS) was used for simultaneous determination of lumefantrine and desbutyl-lumefantrine concentrations as described by Silva et al. 2015 [25]. Limits of quantification for lumefantrine and desbutyl-lumefantrine were 21 and 1.7 ng/mL, respectively. Inter- and intra-assay precision was within 10% CV, and accuracy was within -9% to +6% for all levels of both lumefantrine and desbutyl-lumefantrine [26].
Data and subjects
Data for fifty five children were used for the PPK analysis. They contributed 453 concentrations of lumefantrine and 233 concentrations of desbutyl-lumefantrine to the population pharmacokinetics analysis dataset, yielding an average of 8 and 4 concentrations of lumefantrine and desbutyl-lumefantrine samples/subject, respectively. In this patient population, 56.4 % (n=31 of 55) were males, median (range) age of 35.5 (13.5- 59.7) months, weight of 13.0 (9.0-17.4) kg, height of 88.2 (69.5- 104.7) cm, and BMI of 16.6 kg/m2 (13.6-26.2) kg/m2 . The median creatinine clearance was 51.4 mL/min (range: 24.9-107.7 mL/min) for the 22 subjects who had reported values.
The World Health Organization (WHO) Child Growth Standards for height for age (stunting), weight for age (underweight), and weight for height (wasting) z scores in children were used to classify subjects as being underweight or having normal weight, stunted or not stunted, wasted or not wasted [27]. The cutoff z-scores of <-2 standard deviation below the mean measurement was applied to individual anthropometric measurements to classify the subjects. Twenty three were stunted (height for age ≤-2), while 32 were not stunted. None of the subjects was categorized as wasted (weight for height) because all z scores were >-2.0; and only 3(5.3%) were underweight (weight for age ≤-2). Median total lumefantrine weight adjusted dose was 62.4 mg/kg (range: 48.6-96.0 mg/kg). Treatment was well tolerated. In this study population, three children had new malaria infections during follow up and only one child with Polymerase Chain Reaction (PCR) verified malaria recrudescence was registered on day 28.
Structural model identification
The first order conditional estimation method for nonlinear mixed-effect modeling implemented in NONMEM (version 7.3.0, ICON, Hanover, MD) was used to perform the population PK analysis in this report. A two-compartment PK model parameterized in terms of apparent oral Clearance (CL/F), inter-compartment clearance (Q/F), apparent volumes of distribution of central (V2/F), peripheral (V3/F) compartments, and first order absorption rate constant (KA) was also tested for characterizing lumefantrine PK data as described under Model Evaluation and compared with the one compartment PK model. In addition, a transit compartment absorption model was tested for the characterization of lumefantrine absorption. The a priorispecified level of significance required for the preference of one structural model over another was α=0.005, as assessed by the asymptotically X2 distributed likelihood ratio test. For instance, a one degree of freedom change in model parameter required a log likelihood difference of 7.84, and 10.60 for a two degree of freedom change, among others. Thus, the likelihood ratio test was used to compare the two compartment model, a hierarchical model of the one compartment, with the one compartment model. The selection of the appropriate structural PK model was also based on graphical diagnostic plots.
N-desbutyl-lumefantrine (Metabolite) modeling
One- and two-compartment models were tested for characterizing the PK of the metabolite. The choice of the appropriate model was informed by graphical diagnostics and adequate NONMEM objective function. The following assumptions were made in modeling the desbutyl-lumefantrine data:
The rate constants and volume terms are independent of the amounts of drug and metabolites in the body. That is, linear PK holds.
Reactions involving desbutyl-lumefantrine are unidirectional. Thus, there is no interconversion between desbutyl-lumefantrine and the parent drug.
Since the apparent distribution volume for desbutyl-lumefantrine was unknown, it was fixed to 1 L. Because of fixing the apparent volume of distribution of desbutyl-lumefantrine to 1 L, the apparent clearance (CLM/F) of this metabolite equals its apparent elimination rate (K40).
The metabolite model was parameterized in terms of its formation and metabolite clearance rate. The metabolite formation was initially parameterized to constrain the fraction of metabolite formed between zero and one using a logistic functionas follows:
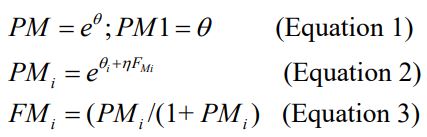
Where PM characterized by θi for desbutyl-lumefantrine is a scalar quantity initially defined to allow the quantification of the fraction of the metabolite (FM) in the i th subject, and PM1 is the parameter. Formation rate constant (K24) was computed as the product of FM formed and the apparent elimination rate of the parent drug. An alternative parameterization with K24 estimated instead of the estimation of the PM for the quantification of the FM was also investigated. The K24 parameterization was used eventually in the modeling of the data because it was more stable than the parameterization using FM. The transfer of the metabolite between the central metabolite compartment and the peripheral metabolite compartment and vice versa were modeled as rate constants K45 and K54, respectively. A one-compartment linear PK model was also tested for the description of the PK of desbutyl-lumefantrine. The PK of the parent drug and metabolite were modeled sequentially.
Pharmacostatistical models
Inter-Subject Variability
Inter-subject variability (η) was modeled as follows:
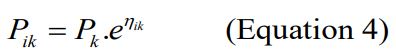
In this model, PK is the typical value for the kth parameter in the population, Pik is the individual value for the kth parameter in the ith subject, and ηik is a random variable in the kth parameter with a mean of zero and variance ΦPK2 . This model assumes that the Pik values are log-normally distributed. Inter-subject variability in PK was estimated as the square root of ΦPK2 , which is an approximation of the coefficient of variation of PK for a lognormally distributed quantity.
Residual variability
Concentrations of lumefantrine and its metabolite were modeled on the natural log scale. The jth concentration in the ith subject was modeled with an additive error as follows:

Where Cmij is the model predicted jth concentration in the ith subject. εij is the random variable that quantifies deviation of the predicted value from an observed concentration in a manner independent of the magnitude of the prediction. εij is symmetrically distributed with zero as the expected value and variance σ2 . The error model in equation 5 is a transformation of both sides of the exponential residual error model.
Population model development
Graphical analysis
Population model development was performed through a combination of data visualization (graphing and fitting using locally weighted regression) in S-PLUS and nonlinear mixed effects modeling. The results of the graphical analysis were used to inform the functional forms for covariates included in the NONMEM analysis for the development of a descriptive PPK model for lumefantrine in the study population. Covariates considered for inclusion into the population model as explanatory variables included age, baseline body Weight (WT), Body Mass Index (BMI), stunting, Age Category (AGECAT), and Wasting Category (CATWAST), Height (HT), food arm (FOOD), Creatinine Clearance (CRCL), dose Group (GROUP), and underweight category. However, graphical analysis enabled the reduction of the covariates to a reasonable number. Thus, age, WT, BMI, stunting, FOOD, HT, and AGECAT were selected for testing during the development of the PPK model.
Over 50% of the subjects had missing creatinine values. Because of the amount of missing data, no attempt was made to impute the missing values. Thus, Creatinine Clearance (CRCL) was not considered as a candidate covariate in any of the models. Age category was examined as part of graphical diagnostics because conversion of age from a continuous to a categorical covariate would have been at the risk of a possible information loss. In addition, it was important to take into account ontogeny in lumefantrine metabolism in the disposition of the drug during the modeling of the data. Thus, age was modeled as continuous covariate. Since HT was correlated with BMI (r=0.68), HT was not tested in the CL/F model. Instead, only BMI was tested to avoid the problem of collinearity.
Covariate models
The effect of a continuous covariate on PPK parameters were tested using a multiplicative power function as shown below.
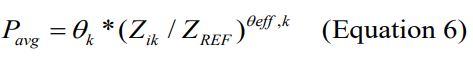
Where Pavg is the average value of a parameter, θk and θoffk are estimated fixed-effect parameters without and with the kth covariate for the kth parameter, Zik is the value of the kth covariate for the ith subject, and ZREF is a reference value for the covariate used in the PPK model. However, age was included CL/F model as a modification of the model for CYP 3A4 maturation reported by Johnson and co-workers [28-31].
Similarly, a binary covariate predicated on the results of graphical analysis was introduced into the model via a linear function:
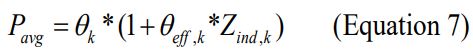
Where is an indicator variable representing one form of a binary covariate (e.g., males coded as 0 and females as 1). In addition, variations of Equation 7 were used to test the effect of a binary covariate in explaining variability associated with structural model parameter estimates, if graphical analysis suggested any relationship between binary covariates and unexplained variability in PK parameters.
Model evaluation
Model evaluation and selection was based on standard model diagnostics and other goodness-of-fit criteria such as the loglikelihood difference, residual error variance, and intersubject variability. Plots of individual weighted residuals versus times, conditional weighted residuals with interaction versus time, and population predicted concentrations were also examined. The extent of shrinkage of empiric Bayesian parameter estimates for the base and final PPK models were obtained directly from NONMEM outputs.
Covariate selection criteria
In NONMEM, the a priori-specified level of significance required for inclusion (i.e., forward selection during model building) and retention (during backward elimination) of a covariate in the nonlinear mixed effect model was α=0.05 and α=0.005, respectively, as assessed by the asymptotically א2 distributed likelihood ratio test. An alpha value of 0.005 was selected for covariate retention due to the multiple comparisons that were performed and the anti-conservative nature of the likelihood ratio test for fixed effects in nonlinear mixed effects models [28,29]. For a one degree of freedom change, a log Likelihood Difference (LLD) of 3.84 and 7.84 at α=0.05 and α=0.005 respectively, is required when two hierarchical models are compared. For a two degree of freedom change at α=0.005, the required LLD is 10.60. Comparison of the actual change in OFV to the critical value determined whether the more complex model was preferred over the simpler model. The more complex model was accepted if improvement in model diagnostics and parameter estimates were observed. For non-nested models the change in OFV was used as a relative measure of goodness of fit just as an Akaike Information Criterion (AIC) value would be used [30]. Thus forward selection was used for the introduction of covariates into the NONMEM model and backward elimination was used to arrive at the final, irreducible, PPK model, given the data. Population PK parameters appropriate to the model being fitted were estimated and reported.
Predictive performance
Model validation was performed using prediction corrected Visual Descriptive Check (pcVPC) using PSN (version 3.5.3). The prediction corrected visual predictive check was used to prevent bias in prediction with the simple VPC on a final, irreducible PPK model, given the data that included covariates. Five hundred datasets were simulated using parameter values from the final model for the determination of the predictive performance of the developed PPK model.
The pcVPC was performed by plotting the observed plasma concentration-time data with the corresponding 2.5th, 50th, and 97.5th percentiles of the model-based predictions. Approximately 95% of the observed values should fall between the 2.5th and 97.5th percentiles of model predictions (the 95% prediction interval). The predictions were stratified by analyte; that is, parent drug and metabolite.
Results
Graphical analysis
The development of the PPK model proceeded from structural model identification for use as the base model, through graphical analysis, to the development of the PPK model. A twocompartment linear pharmacokinetic model performed better than the one compartment model in the characterization of both the PK of lumefantrine and desbutyl-lumefantrine (Figure not shown).
There appeared to be some relationship between lumefantrine unexplained variability in CL/F and BMI, weight, and age (Figure 1a). The relationship between unexplained variability in CL/F and BMI was more prominent than that of weight, and BMI yielded a lower objective function than when weight was introduced into the CL/F model (Figure 1a). Apparent volume of the central compartment appeared to be related to weight (Figure 1b).
Model evaluation and population pharmacokinetic model development
The two-compartment model adequately described the PK of lumefantrine and desbutyl-lumefantrine as observed with the individually weighted residuals versus time plots for both the base and final models (Figure 2). There are no trends in the residuals, indicating a lack of time dependencies. Thus, the PK of lumefantrine and its metabolite is time invariant. In addition, the residual error models adequately described the concentrations of both lumefantrine and desbutyl-lumefantrine. However, it was necessary to use two residual errors in modeling lumefantrine concentration for the elimination of minimal bias associated with the characterization of the lumefantrine concentration-time data in the zero to the 200 hr time range. Thus, one residual error model was used for time less than or equal to 200 hr and another for time greater than 200 hr. The 200 hr time point (threshold) was selected based on the examination of diagnostic plots and sensitivity analysis. This approach resulted in the highest decrease in the objective function value (-4.653) when the base model with one residual model was compared with the one with two residual error models. It also resulted in the almost complete elimination of the bias that was observed in the zero to 200 hr range (not shown).This threshold has no clinical value; and the approach has been used previously in the PPK modeling of cetirizine data in atopic dermatitis children aged 12 to 24 months [32,33]. The usefulness of this approach is for the improvement of goodness-of-fit of the model. The minimal biases in the prediction of low and high concentrations in the base model were eliminated in the final, irreducible, PPK model, given the data (Figure 3).
The final PPK model was given by:
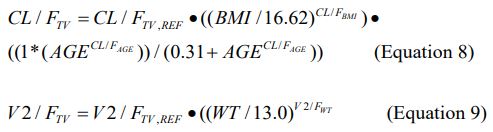
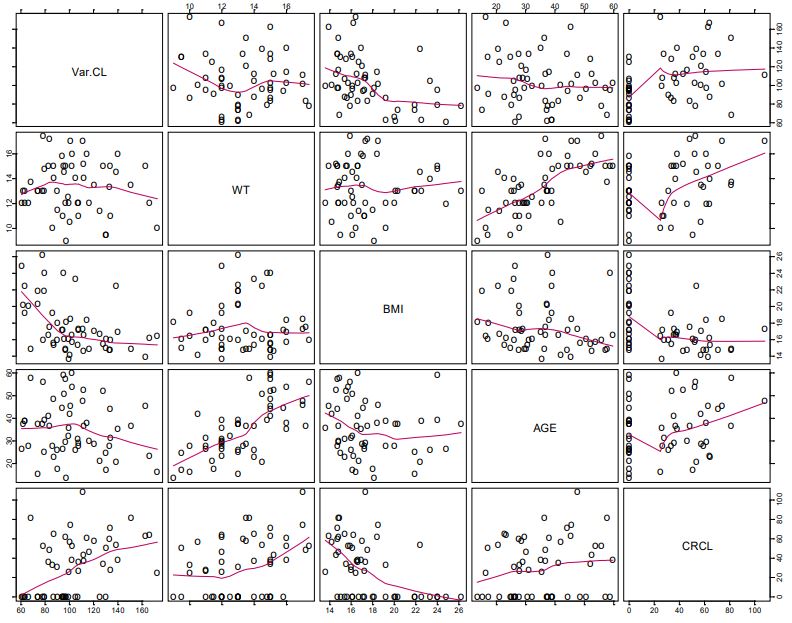
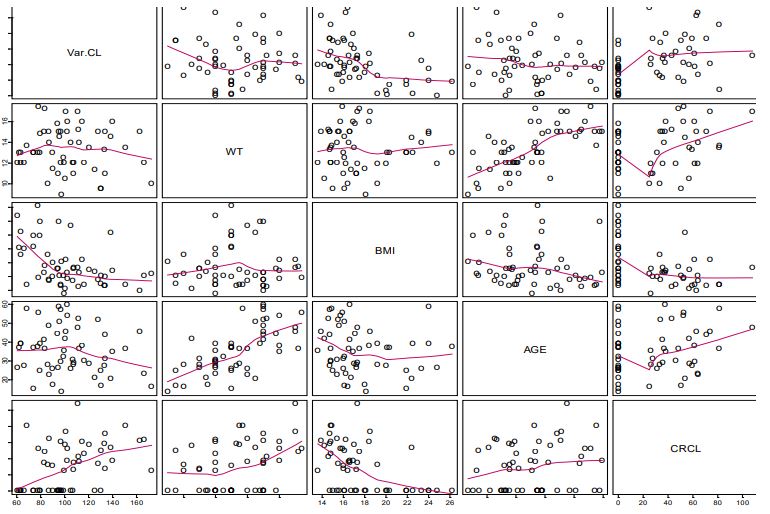
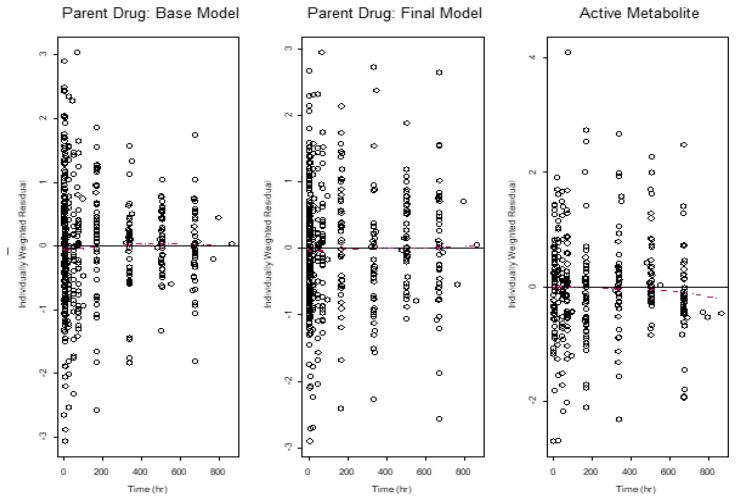
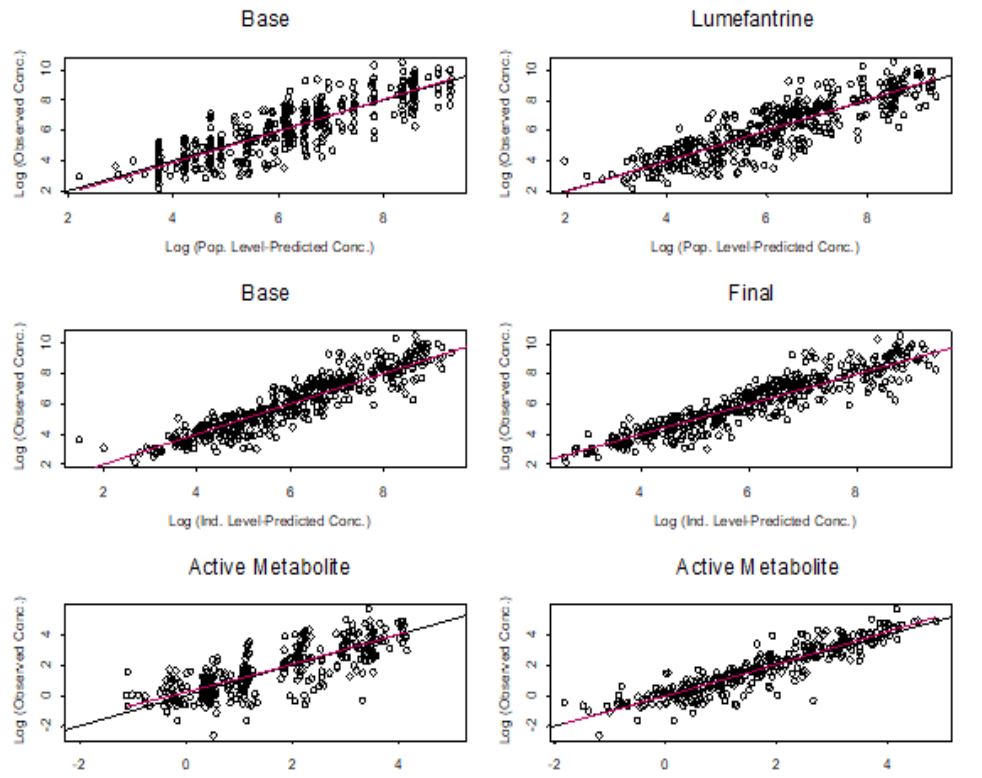
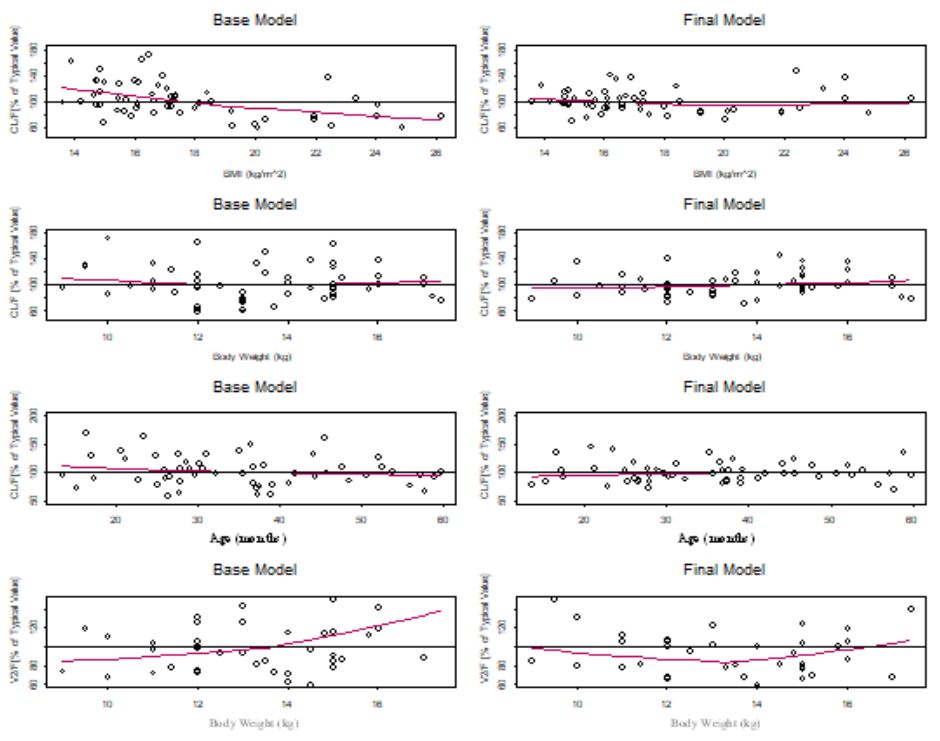
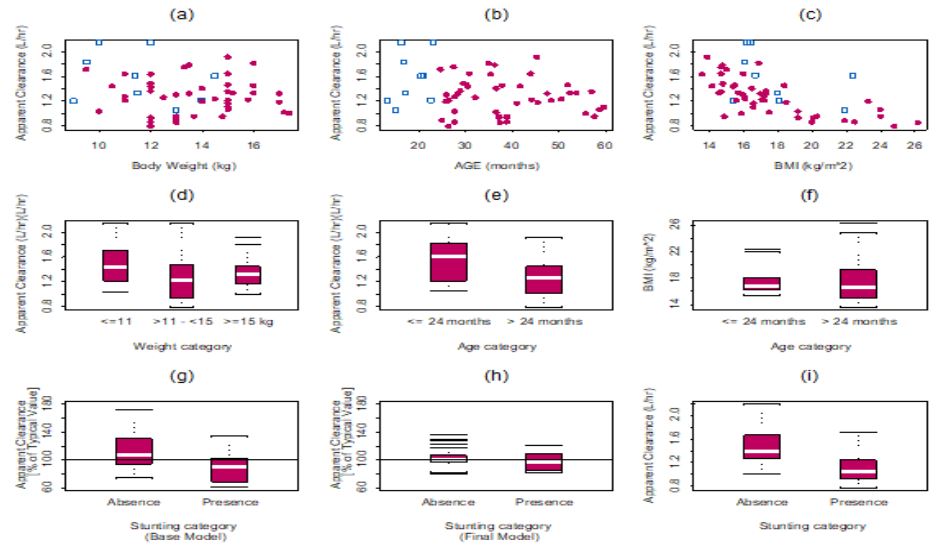
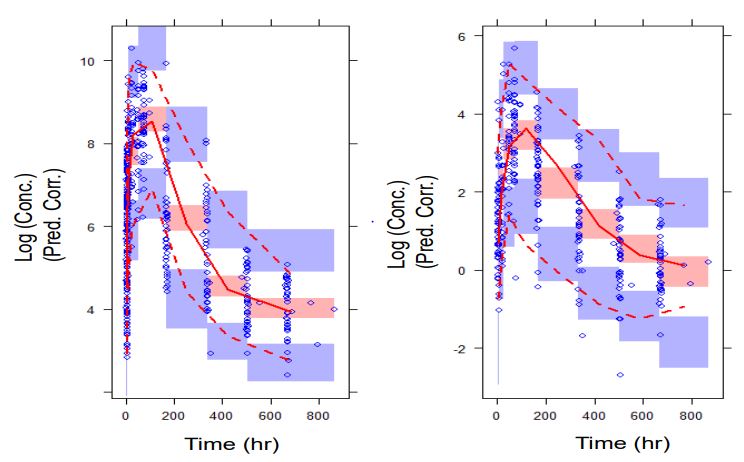
Table 1: Summary of population pharmacokinetic parameters.
| Parameter [Units] | Parameter Estimatea | RSEe | 95% CIf | Shrinkage (%) |
|---|---|---|---|---|
| CL/FTV,REF [L/hr] | 3.19 | 24.4% | 1.67, | 4.72 |
| V2/FTV,REF [L] | 28.1 | 18% | 18.2, | 38.0 |
| Q/FTV [L/hr] | 0.176 | 15.6% | 0.12, | 0.23 |
| V3/FTV [L] | 58.4 | 16.2% | 39.8, | 77.0 |
| KATV [hr-1] | 0.0383 | 11.9% | 0.029, | 0.047 |
| ALAG1TV [hr] | 0.980 | - | ||
| CL/FBMI | -1.10 | - | ||
| V2/FWT | 1.06 | - | ||
| CL/FAGE | -0.423 | 27.2% | -0.648, | -0.198 |
| K24 M,TV [hr-1] | 0.00003 | 23.3% | 0.0000163, | 0.0000437 |
| CLM,TV [L/hr] | 0.0977 | 25.3% | 0.049, | 0.146 |
| K45TV [hr-1] | 0.0578 | 48.2% | 0.003, | 0.112 |
| K54TV [hr-1] | 0.00815 | 23.1% | 0.004, | 0.012 |
| Inter-Individual Variabilityc (IIV) | ||||
| Description | Estimate | RSE | Shrinkage | |
| ω2CL/F | 0.0492 (22.2%) | 31.3% | 0.0190, 0.0794 | 24.7% |
| ω2V2/F | 0.623 (78.9%) | 30.7% | 0.2486, 0.9974 | 19.1% |
| ω2ALAG1 | 0.0029 (5.39%) | - | 85.5% | |
| ω2K24 | 0.557 (74.6%) | 28.0% | 0.153, 0.463 | 16.1% |
| Residual Variabilityd | ||||
| SDRes. Error1, LUMEFANTRINE | 0.847 | 4.30% | 0.775, 0.919 | 5.8% |
| SDRes Error2, ,LUMEFANTRINE | 0.483 | 7.90% | 0.408, 0.558 | 13.3% |
| SDRes. Error, DESBUTYLLUMEFANTRINE | 0.786 | 4.50% 0.717, | 0.855 | 8.9% |
Where CLTV, REF, and V2/FTV, REF, are the typical values of CL/F and V2/F at the reference (i.e., median) BMI and weight values of 16.62 kg/m2 and 13.0 kg, respectively. The constant 0.31 in Equation 8 was determined by objective function profiling to be the best value for characterizing the ontogeny component of the CL/F model. All other structural model parameters for drug (KA, Q/F, V3/F, and ALAG1) and metabolite (K24, CLM/F (metabolite clearance), K45, and K54) were estimated at their typical values. Because the apparent volume of the metabolite compartment was fixed at 1.0, CLM/F .is equal to the rate of elimination of the metabolite, K40. K24 is the rate constant of formation of the metabolite. K45 is the transfer rate constant between the first and second metabolite compartments, and K54 is the transfer rate constant between the second and first metabolite compartments. K24 was estimated instead of the fraction of metabolite formed, and latter was computed from the relationship between K24 and the ratio of CL/F and V2/F.
The parameters for the PPK model are summarized in Table 1. The fixed effect parameters were precisely estimated. In addition, the estimate of the allometric exponent for BMI on CL/F was first estimated and then fixed to the estimated value. This was to minimize the effect of correlation between BMI and age in the CL/F model. Equally, the allometric exponent of weight on V2/F was first estimated and then fixed to avoid collinearity problems with age in the PPK model. Although the inclusion of weight in the V2/F model resulted in only a 1.655 decrease in the objective function which was not significant, it was retained in the model for allometric reason.
The population average half-life of elimination of lumefantrine from the central compartment was computed with individual empiric Bayesian parameter estimates, using standard formula, to be 14.6 hr. Lumefantrine median half-life of the beta-elimination phase was computed to be 238 hr. The median distribution half-life for lumefantrine was 7.95 hr. The population average KA was approximately 0.04 hr-1. The estimates of fixed and random effects parameters in the model parameters were precise (Table 1). The shrinkage associated with the estimation of variability in parameter estimates were acceptable (<35%). The variability in lag time was fixed to a small value since the data did not support the estimation of the variability in lag time. The data did not support the estimation of covariance between CL/F and V2/F at the individual subject level, intervariability in Q/F, V3/F and all the metabolite PK parameters, except K24.
The model that described the desbutyl-lumefantrine data best was the two-compartment model. The apparent rate of elimination of desbutyl-lumefantrine (K40) from the central metabolite compartment was estimated to be 0.0979 hr-1, yielding a corresponding central metabolite compartment elimination half-life of 7.08 hr. The rate of transfer of the metabolite from the central to the peripheral metabolite compartment was estimated to be faster than that from the peripheral to the central metabolite compartment [0.0578 hr-1 (K45) versus 0.0.00815 hr-1 (K54)]. The rate of formation of desbutyl-lumefantrine formed was estimated to be 0.00003 hr-1, yielding 0.08% fraction of the metabolite formed. The median distribution half-life of the metabolite was computed to be 7.09 hr, and the beta-elimination half-life was computed to be 85.1 hr. No covariate was included in the desbutyl-lumefantrine model because graphical analysis did not inform such.
The full PPK model was the final (irreducible) PPK model. It was developed with the inclusion of BMI and ontogeny in the CL/F of the parent drug, and weight in the V2/F model. Weight was not a significant explanatory variable for the variability in CL/F. The inclusion of age and BMI in the lumefantrine CL/F model and weight in the V2/F model eliminated most of the bias in the prediction of lumefantrine PPK, thereby eliminating most of the unexplained variability due to weight and age (Figure 5). With BMI alone in the CL/F model, intersubject variability in CL/F decreased from 29.0% in the base model to 24.0% with a further decrease to 22.2% in the final CL/F model when age was included. Thus, BMI was the most important covariate in explaining the intersubject variability in the CL/F of lumefantrine the intersubject variability in V2/F decreased from 83.7% in the base model to 78.9% in the final V2/F model with weight included. Once BMI was included in the CL/F model, the unexplained variability in CL/F due to stunting was explained (Figure 6). The CL/F of lumefantrine decreased with age in going from two to five years of age (Figure 6). It is important to note the relationship between estimated lumefantrine CL/F and the following covariates: BMI, age, and stunting category (Figure 6). The CL/F of lumefantrine was found to decrease with increasing BMI, and BMI is computed from height and weight. It is also of interest to note that the intersubject variability in CL/F was explained with BMI and age. Age was modeled to account for ontogeny in CYP 3A4 using an Emax model formulation similar to that previously reported [34]. In this case, however, the parameters of the ontogeny model were estimated to ensure that the model that best described ontogeny in CYP 3A4 metabolism of lumefantrine was used to characterize the ontogeny in lumefantrine CL/F in the population studied. Once BMI (a composite covariate of weight and height), and age were introduced into the CL/F model, weight, height, or stunting as a categorical covariate were not needed in the model. The CL/F of lumefantrine tended to be higher in infants (i.e., < = 2 years old) than in children older than two years old (Figure 6).
Predictive performance
The predictive performance of the model showed that the PPK model developed adequately characterized lumefantrine and desbutyl-lumefantrine concentrations (Figure 7). Thus, there is confidence in the performance of the model, which makes the model appropriate for its intended use, the characterization of the PPK of lumefantrine and desbutyl-lumefantrine in children under 5 years old.
Day 7 Lumefantrine and Desbutyl-lumefantrine Concentrations
In this <5 year old population, median (interquartile range) day 7 lumefantrine concentration (C(LUM)D7) was 441 (243 - 1394) ng/mL. The day 7 desbutyl-lumefantrine concentrations ranged from 0 to 74.2 ng/ml (median: 14.7 ng/ml).
Discussion
Artemether lumefantrine was approved for use in China in 1992, Africa and the European Union in 1999, and by the US Food and Drug Administration in 2009 [35]. Few PPK studies, have explored variability in lumefantrine exposure among children [12,36,37] but without particular information in vulnerable <5 year old population. However, recently the population PK of lumefantrine has been described among Ugandan children <2 years [38].
To our knowledge, this is the first report of the characterization of the population PK of lumefantrine and its desbutyllumefantrine among children <5 years of age. This is the first population-based PK model for lumefantrine that incorporates ontogeny in CYP 3A4 mediated metabolism and allometric considerations in characterizing the PK of lumefantrine in children under 5 years of age. The allometric considerations involved the use of bodyweight-dependent exponent model for apparent volume of distribution of the central compartment and BMI-dependent exponent model for CL/F. Body weight was not related to CL/F (Figure 2a); therefore, 3/4 allometric scaling model for CL/F could not be applied. In addition, it has been previously reported that the 3/4 allometric scaling model for CL/F adequately described clearance in adults and older children, but overestimated CL/F children under 15 kg in weight [39].
The PPK of lumefantrine was described using a linear twocompartment model with first order absorption and first-order elimination as lumefantrine previously reported [4,38-43]. A three-compartment has also been used to characterize the PK of lumefantrine [12], while others have applied a one-compartment PK model [36,37,44,45]. The choice of a structural PK model is, however, dependent upon the sampling scheme employed in a study. Model predictive performance via pcVPC indicated that the final model adequately characterized the PK of lumefantrine and desbutyl-lumefantrine; and hence PPK of lumefantrine and desbutyl-lumefantrine in children under five years old. Although a descriptive PPK model was developed which does not require validation [46], we validated the model nonetheless by determining its predictive performance. The predictive performance not only serves the purpose of validation, but it also serves a model evaluation purpose. The predictive performance result indicated that the adequacy of PPK model, hence its generalizability [46].
Lumefantrine is metabolized primarily into desbutyl-lumefantrine [20-23] by CYP 3A4 [17,18]. Ontogeny in CYP 3A4 maturation was incorporated into the estimation of lumefantrine CL/F. The combination of allometric scaling and ontogeny has been shown to produce similar results as physiological based pharmacokinetic modeling for low extraction ratio drugs [47], and lumefantrine is a low extraction drug. In the present study, the change in lumefantrine CL/F, on average, from one year and two years old to greater than two years old is approximately -20.6%. For our dataset, the CL/F of lumefantrine decreased with age from one to 5 years old. This could be due to increased apparent clearance (Figure 6). It has been reported that CYP 3A4 activity in infants reaches peak activity at 6 months [48], and thereafter activity appears to decline after infancy [49-51]. This trend of high apparent oral clearance during infancy that decreased with age has been previously observed for some CYP3A4 substrates including midazolam [52], tacrolimus [53], and lopinavir [54].
Our reported higher CL/F in children ≤2 year old compared with those of children older than 2 years is in agreement with the report by other authors applying meta-analysis of day 7 lumefantrine concentrations and therapeutic response using individual patient data [11]. The authors reported the concentration of lumefantrine in children below 2 years to be lower than those of subjects above 2 years of age, regardless of nutritional status [11]. Lower concentration of lumefantrine in children less than 2 years old when compared with those greater than 2 years old is suggestive of higher CL/F in the under 2 year olds. Our study result is thus confirmatory of the meta-analysis results [10,11].
It is also of interest to note that the variability in CL/F was explained with BMI (a composite covariate of weight and height) and age, and not weight. The finding that weight is not related to CL/F is in agreement with an earlier report by Hatz et al., that weight had no significant effect on lumefantrine PK [55]. The effect of wasting on our study outcome could not be assessed because no subjects had wasting in our dataset. Subjects who weighed less than 11 kg had higher CL/F than those with weights greater than 11 kg, and CL/F decreased with increasing BMI (Figure 5). Once BMI was included in the model, including stunting did not result in any additional significant improvement of the objective function. Thus, BMI inclusion in the CL/F model explained the unexplained variability that was due to stunting (Figure 6). It is worth noting that stunted subjects also had lower CL/F (Figure 6), and this points to the importance of BMI in the CL/F model.
It is important to note that high BMI has been reported to be associated with low CYP3A4 expression in both the liver and small intestine [56]. In addition, BMI and not weight has been found to be a significant predictor of the variability in CYP 3A4 activity [57]. These findings could explain our finding of the relationship between BMI and lumefantrine apparent clearance in our study since the drug is cleared by via CYP 3A4 metabolism. Moreover, BMI has been identified as an important predictor for elimination patterns of other CYP3A4 substrates such as cyclosporine [58] and tacrolimus [59]. In addition, the inclusion of age in the CL/F model with the model formulation accounting for ontogeny in CYP 3A4 isozyme maturation appropriately accounted for the importance of CYP 3A4 in the elimination of lumefantrine.
Although the subject demographics are not comparable with those in our study, the influence of age and weight on the disposition of lumefantrine was reported earlier by Ezzet et al. [4]. The age range of subjects in their study is outside the age range we studied. The least age in that study was 15 years, while the oldest subject in our study was ≈5 years.
The estimate of inter-subject variability in CL/F and V2/F was 24.4% and 18%, respectively. The data did not support the estimate of intersubject variability in KA. Oral bioavailability of lumefantrine is dependent on dietary fat [4]. The lag time and KA values of approximately 1.0 hr and 0.04 hr-1, respectively, obtained this study are similar to those reported by Kloprogge et al. [44]. However, in the present study the fat content was similar in both food arms making food effect not to be of importance in this analysis. The estimate of intersubject variability in CL/F in our study is similar to that reported by Salman et al [12].
In this under five population, reference CL/F with a reference median BMI of 16.62 kg/m2 at the weight of 13.0 kg is estimated at 3.19 (95% CI: 1.67, 4.72) L/h. The estimated CL/F for lumefantrine in a typical 12 months old with a BMI of 16.62 kg/m2 (the reference (median) value of BMI in this dataset) was 1.69 L/hr. With the same reference BMI in the data set, the corresponding CL/F values for a 24 and 36 months old were 1.46 and 1.32 L/hr respectively. A 48 month old with a reference BMI of 16.62 kg/ m2 is estimated to have lumefantrine CL/F of 1.23 L/hr, while a 60 month old with the same reference BMI had a CL/F of 1.16 L/hr. Thus, the CL/F of lumefantrine decreased by 31.4% in going from 12 to 60 months of age. A 12 month old with a BMI of 13 kg/m2 is estimated to have lumefantrine CL/F of 2.21 L/ hr, while 15 month old with same BMI is estimated to have to have lumefantrine CL/F of 2.12 L/hr. Our finding of increased CL/F among children <2 years and with lower BMI (see Equation 8) is in agreement with CL/F estimates of 2.19 L/hr reported by Tchaparian et al., for a typical child between 1 and 2 years of age with weight of 8.43 kg [38].
The population average apparent elimination half-lives of the parent and active metabolite from the central metabolite compartment were computed to be 14.6 hr and 7.09 hr, respectively. The population average apparent elimination half-life is in agreement with the 12-hourly maintenance dosing of lumefantrine. In computing the central compartment elimination halflife, it is important to note that a sequential modeling approach was adopted. That is, the parent drug was modeled first with the PPK parameter estimates fixed and linked to the metabolite model for the estimation of metabolite PK. Lumefantrine median t1/2β was computed to be 12.9 days. Terminal elimination half-life estimates are a function of the duration of PK sampling. This is in the range of the t1/2β of 10 days reported by Levefre et al. [60] and 14 days reported by Tchaparian and coworkers [38]. Other literature reports with shorter t1/2β, for instance 3 days [37], are probably due to higher LOQ or shorter sampling times. We sampled for 28 days, and lumefantrine was still detectable in several individuals as previously reported [26]. The median distribution half-life for lumefantrine of 7.95 hr is similar to that reported by Salman et al. [12]. The median beta elimination phase half-life for the active metabolite in our study was 3.54 days, and this is in the range of 3 to 10 days reported in the literature [4,38,60].
Although ratio of metabolite to parent drug measured at any one point appears to be low, they are within ranges reported previously [5,6,16-20]. The fraction of desbutyl-lumefantrine formed was estimated to be less than 1%. This finding is agreement with the report that the metabolite represents less than 1% of lumefantrine exposure in malaria patients [61].
The median C(LUM)D7 (441 ng/mL) observed in this study is similar to an earlier report on AL treatment for acute uncomplicated falciparum malaria among <5 year old children in Uganda (median C(LUM)D7: 376 vs 249 ng/mL under supervised and unsupervised treatments respectively) [15], and approximately 490 ng/mL reported in a meta-analysis for under 5 year old children [11]. The meta-analyses report demonstrated that current dose recommendations are still efficacious; however, the authors observed lowest exposure and cure rates among “very young Asian children between 10-15 kg” and “malnourished African children between 1-3 years” [10,11]. Our findings suggest that BMI should be further explored in AL dosage regimen design in children under five year of age irrespective their nutritional status. However, PK/PD considerations are outside the scope of this work. There was only one child with PCR verified AL treatment failure.
Conclusion
A PPK model was developed for lumefantrine and its metabolite, desbutyl-lumefantrine. For both analytes the PK was characterized with a two-compartment model. The CL/F of lumefantrine was characterized as a function of BMI and age, incorporating ontogeny, while the apparent central volume of distribution of lumefantrine was a function of body weight. The CL/F of lumefantrine decreased with age as subject age increased from two to less than five years old. This could due to increased clearance in infants because of CYP 3A4 activity. Our results indicate that BMI, a composite variable of weight and height, is more important than stunting alone in explaining the variability in lumefantrine CL/F. However, the impact of stunting on the disposition of lumefantrine may need to be studied further. Our findings about influence of BMI and age on disposition of lumefantrine provides a structural basis for further investigation and development of rational AL dosing guidelines among under five year olds; and indicate the need for the exploration of age specific AL dose schemes that are further adjusted for BMI with a view to providing rational AL doses for under five year old children, regardless of nutritional status.
Acknowledgements
All authors declare no conflict of interest.
We are grateful to the participants, their parents, study teams for making for their commitment to the study. We thank members of Department of Pharmacology & Therapeutics for the support. We are grateful to Regina Nakafeero, Sam Nsobya, Moses Kiggundu and their team for the laboratory quality control. We thank Manijeh Vafa Homann and Anna Färnert, from Unit of Infectious Diseases, Department of Medicine Solna, Karolinska Institutet, Sweden for their assistance with malaria genotyping. This study was funded by Sida as part of support to Makerere University / Karolinska Institute Research Collaboration, Grants from Swedish Research Council (VR 2011-3440 and VR-LINK 2011-7381) and Anoixis Corporation.
References
- World Health Organization (WHO). Guidelines for the treatment of malaria. Accessed. 2023. https://apps.who.int/iris/handle/10665/162441.
- White NJ, Olliaro PL. Strategies for the prevention of antimalarial drug resistance: Rationale for combination chemotherapy for malaria. Parasitology Today. 1996; 12(10): 399-401.
- Uganda MoH. Management of Uncomplicated Malaria. A practical Guide for Health Workers. Malaria Control Programme 3rd Edition. 2005.
- Ezzet F, Mull R, Karbwang J. Population pharmacokinetics and therapeutic response of CGP 56697 (artemether + benflumetol) in malaria patients. Br J Clin Pharmacol. 1998; 46(6): 553-61.
- Price RN, Uhlemann AC, Van Vugt M, Brockman A, Hutagalung R, et al. Molecular and pharmacological determinants of the therapeutic response to artemether-lumefantrine in multidrugresistant Plasmodium falciparum malaria. Clin Infect Dis. 2006; 42: 1570-1577.
- Djimdé A, Lefèvre G. Understanding the pharmacokinetics of Coartem®. Malar J. 2009; 8(1): S4.
- Hines RN. Developmental expression of drug metabolizing enzymes: Impact on disposition in neonates and young children. Int J Pharm. 2013; 452(1-2): 3-7.
- Bartelink IH, Rademaker CM, Schobben AF, Van den Anker JN. Guidelines on paediatric dosing on the basis of developmental physiology and pharmacokinetic considerations. Clin. Pharmacokinet. 2006; 45: 1077-1097.
- Kearns GL, Abdel-Rahman SM, Alander SW, Blowey DL, Leeder JS, et al. Developmental pharmacology-drug disposition, action, and therapy in infants and children. N Engl J Med. 2003; 349: 1157-1167.
- Worldwide Antimalarial Resistance Network (WWARN) AL Dose Impact Study Group. The effect of dose on the antimalarial efficacy of artemether-lumefantrine: A systematic review and pooled analysis of individual patient data. Lancet Infect Dis. 2015; 15: 692-702.
- Worldwide Antimalarial Resistance Network (WWARN). Lumefantrine PK/PD Study Group. Artemether-lumefantrine treatment of uncomplicated Plasmodium falciparum malaria: A systematic review and meta-analysis of day 7 lumefantrine concentrations and therapeutic response using individual patient data. BMC Medicine. 2015; 13: 227.
- Salman S, Page-Sharp M, Griffin S, Kose K, Siba PM, et al. Population pharmacokinetics of artemether, lumefantrine, and their respective metabolites in Papua New Guinean children with uncomplicated malaria. Antimicrob Agents Chemother. 2011; 55 (11): 5306-5313.
- Djimdé AA, Tekete M, Abdulla S, Lyimo J, Bassat Q, et al. Pharmacokinetic and pharmacodynamic characteristics of a new pediatric formulation of artemether-lumefantrine in African children with uncomplicated Plasmodium falciparum malaria. Antimicrob Agents Chemother. 2011; 55(9): 3994-3999.
- Borrmann S, Sallas WM, Machevo S, González R, Björkman A, et al. The effect of food consumption on lumefantrine bioavailability in African children receiving artemether-lumefantrine crushed or dispersible tablets (Coartem®) for acute uncomplicated Plasmodium falciparum malaria. Tropical Medicine & International Health. 2010; 15(4): 434-441.
- Checchi F, Piola P, Fogg C, Bajunirwe F, Biraro S, et al. Supervised versus unsupervised antimalarial treatment with six-dose artemether-lumefantrine: pharmacokinetic and dosage-related findings from a clinical trial in Uganda. Malar J. 2006; 5: 59.
- Piola P, Fogg C, Bajunirwe F, Biraro S, Grandesso F, et al. Supervised versus unsupervised intake of six-dose artemether-lumefantrine for treatment of acute, uncomplicated Plasmodium falciparum malaria in Mbarara, Uganda: A randomised trial. Lancet. 2005; 365(9469):1467-73.
- Lefèvre G, Carpenter P, Souppart C, Schmidli H, McClean M, et al. Pharmacokinetics and electrocardiographic pharmacodynamics of artemether-lumefantrine (Riamet®) with concomitant administration of ketoconazole in healthy subjects. Br J Clin Pharmacol. 2002; 54(5): 485-492.
- Novartis, Coartem International Package Leaflet. East Hannover, NewJersey. 2015.
- Ntale M, Ogwal-Okeng JW, Mahindi M, Gustafsson LL, et al. A field-adapted sampling and HPLC quantification method for lumefantrine and its desbutyl metabolite in whole blood spotted on filter paper. Journal of Chromatography B. 2008; 876: 261-265.
- Wong RPM, Salman S, Ilett KF, Siba PM, Mueller I, et al. Desbutyl-lumefantrine is a metabolite of lumefantrine with potent in vitro antimalarial activity that may influence artemether-lumefantrine treatment outcome. Antimicrob Agents Chemother. 2011; 55: 1194-1198.
- Starzengruber P, Kollaritsch H, Sirichaisinthop J, Wernsdorfer G, Congpuong K, et al. Interaction between lumefantrine and monodesbutyl-benflumetol in Plasmodium falciparum in vitro. Wien Klin Wochen. 2008; 120: 85-89.
- Noedl H, Allmendinger T, Prajakwong S, Wernsdorfer G, Wernsdorfer WH. Desbutyl-benflumetol, a novel antimalarial compound: In vitro activity in fresh isolates of Plasmodium falciparum from Thailand, Antimicrob Agents Chemother. 2001; 45: 2106-2109.
- Müller G, Wernsdorfer G, Sirichaisinthop J, Starzengruber P, Congpuong K, et al. Synergism between monodesbutyl-benflumetol andartemisinin in Plasmodium falciparum in vitro. Wien Klin Wochen. 2008; 120: 80-84.
- Mwebaza N, Jerling M, Gustafsson LL, Silva AV, Pohanka A, et al. Oil‐Fortified Maize Porridge Increases Absorption of Lumefantrine in Children with Uncomplicated Falciparum Malaria. Basic & Clinical Pharmacology & Toxicology. 2016. DOI: 10.1111/bcpt.12714.
- World Health Organization. Assessment and Monitoring of Antimalarial Drug Efficacy for the Treatment of Uncomplicated Falciparum Malaria. Geneva, Switzerland: WHO; Technical document. 2003. WHO/RBM/HTM/2003.50.
- Silva AV, Mwebaza N, Ntale M, Gustafsson LL, Pohanka A. A fast and sensitive method for quantifying lumefantrine and desbutyl-lumefantrine using LC- MS/MS. J. Chromatogr B. 2015; 1004: 60 - 66.
- World Health Organization, UNICEF. WHO child growth standards and the identification of severe acute malnutrition in infants and children: A Joint Statement by the World Health Organization and the United Nations Children’s Fund. Geneva: World Health Organization. 2009. http://apps.who.int/iris/handle/10665/44129.
- Pinheiro JC, Bates DM (eds). Mixed-Effects Model in S and SPLUS. New York, Springer. 2000.
- Wählby U, Jonsson EN, Karlsson MO. Assessment of actual significance levels for covariate effects in NONMEM. J Pharmacokinet Pharmacodyn. 2001; 28: 231-252.
- Ette EI. Comparing non-hierarchical models: Application to nonlinear mixed effects modeling. Computers Biol Med. 1996; 26: 505-512.
- Ette EI. Population model stability and performance. J Clin Pharmacol. 1997; 37: 486 - 495.
- Ette EI, Onyiah LC. Estimating inestimable standard errors in population Pharmacokinetic studies: The bootstrap with winsorization. Eur J Drug Metab Pharmacokinet. 2002; 27: 213 - 224.
- Hussein Z, Pitsiu M, Majid O, Aarons L, De Longueville M, et al. Retrospective population pharmacokinetics of levocetirizine in atopic children receiving cetirizine: The ETAC® study. Br J Clin Pharmacol. 2005; 59(1): 28-37.
- Johnson TN, Rostami-Hodjegan A, Tucker GT. Prediction of clearance of eleven drugs and associated variability in neonates, infants and children. Clin Pharmacokinet. 2006; 931-956.
- Novartis, Coartem International Package Leaflet. Novartis Pharmaceuticals Corporation East Hanover, New Jersey 07936 © Novartis. 2015.
- Staehli Hodel EM, Guidi M, Zanolari B, Mercier T, Duong S, et al. Population pharmacokinetics of mefloquine, piperaquine and artemether-lumefantrine in Cambodian and Tanzanian malaria patients. Malar J. 2013; 12: 235.
- Hietala S, Mårtensson A, Ngasala B, Dahlström, S, Lindegårdh N, et al. Population pharmacokinetics and pharmacodynamics of artemether and lumefantrine during combination treatment in children with uncomplicated falciparum malaria in Tanzania. Antimicrob Agents Chemother. 2010; 54: 4780-4788.
- Tchaparian E, Sambol NC, Arinaitwe E, McCormack SA, Bigira V, et al. Population pharmacokinetics and pharmacodynamics of lumefantrine in young Ugandan children treated with artemether-lumefantrine for uncomplicated malaria. J Infect Dis. 2016; 214(8): 1243-51.
- Wang C, Peeters MYM, Allegaert K, Blussé van Oud-Alblas HJ, Krekels EHJ, et al. A body weight-dependent allometric exponent for scaling clearance across the human life-span. Pharm Res. 2012; 29: 1570-1581.
- Tarning J, McGready R, Lindegardh N, Ashley EA, Pimanpanarak M, et al. Population pharmacokinetics of lumefantrine in pregnant women treated with artemether-lumefantrine for uncomplicated Plasmodium falciparum malaria. Antimicrob Agents Chemother. 2009; 53: 3837-3846.
- Kloprogge F, Piola P, Dhorda M, Muwanga S, Turyakira E, et al. Population Pharmacokinetics of Lumefantrine in Pregnant and No pregnant Women with Uncomplicated Plasmodium falciparum Malaria in Uganda. CPT: Pharmacometrics & systems pharmacology. 2013; 2: e83.
- Hoglund RM, Byakika-Kibwika P, Lamorde M, Merry C, Ashton M, et al. Artemether-lumefantrine co-administration with antiretrovirals: Population pharmacokinetics and dosing implications. Br J Clin Pharmacol. 2015; 79: 636-49.
- Maganda BA, Ngaimisi E, Kamuhabwa AA, Aklillu E, Minzi OM. The influence of nevirapine and efavirenz-based anti-retroviral therapy on the pharmacokinetics of lumefantrine and anti-malarial dose recommendation in HIV-malaria co-treatment. Malar J. 2015; 14:179.
- Kloprogge F, McGready R, Hanpithakpong W, Blessborn D, Day NP, et al. Lumefantrine and desbutyl-lumefantrine population pharmacokinetic-pharmacodynamic relationships in pregnant women with uncomplicated Plasmodium falciparum malaria on the Thailand-Myanmar border. Antimicrobial agents and chemotherapy. 2015; 59(10): 6375-84.
- Mosha D, Guidi M, Mwingira F, Abdulla S, Mercier T, et al. Population pharmacokinetics and clinical response for artemetherlumefantrine in pregnant and nonpregnant women with uncomplicated Plasmodium falciparum malaria in Tanzania. Antimicrob Agents Chemother. 2014; 58(8): 4583-92.
- Ette EI, Williams PJ, Kim YH, Lane JR, Liu MJ, et al. Model appropriateness and population pharmacokinetic modeling. J Clin Pharmacol. 2003; 43(6): 610-623.
- Strougo A, Eissing T, Yassen A, William S, Danhof M. First dose in children: Physiological insights into pharmacokinetic scaling approaches and implications in pediatric drug development. J Pharmacokinet Pharmacodyn. 2012; 195-203.
- Tayman C, Rayyan M, Allegaert K. Neonatal pharmacology: Extensive interindividual variability despite limited size. J Pediatric Pharmacol Ther. 2011; 16(3): 170-184.
- Salem F, Johnson TN, Abduljalil K, Tucker GT, Rostami-Hodjegan A. Erratum to: A Re-evaluation and validation of ontogeny functions for cytochrome P450 1A2 and 3A4 based on in vivo data. Clin Pharmacokinet. 2015; 54: 671.
- Ince I, Knibbe CA, Danhof M, De Wildt SN. Developmental changes in the expression and function of cytochrome P450 3A isoforms: Evidence from in vitro and in vivo investigations. Clin Pharmacokinet. 2013; 52(5): 333-345.
- De Wildt SN, Kearns GL, Leeder JS, Van den Anker JN. Cytochrome P450 3A. Clin Pharmacokinet. 1999; 37(6): 485-505.
- Peeters MY, Prins SA, Knibbe CA, DeJongh J, Mathôt RA, et al. Pharmacokinetics and pharmacodynamics of midazolam and metabolites in nonventilated infants after craniofacial surgery. Anesthesiology. 2006; 105(6): 1135-46.
- Gijsen V, Mital S, Van Schaik RH, Soldin OP, Soldin SJ, et al. Age and CYP3A5 genotype affect tacrolimus dosing requirements after transplant in pediatric heart recipients. J Heart Lung Transpl. 2011; 30(12): 1352-9.
- Nikanjam M, Chadwick EG, Robbins B, Alvero C, Palumbo P, et al. Assessment of Lopinavir Pharmacokinetics With Respect to Developmental Changes in Infants and the Impact on Weight Band-Based Dosing. Clin Pharmacol Ther. 2012; 91(2): 243-249.
- Hatz C, Soto J, Nothdurft HD, Zoller T, Weitzel T, et al. Treatment of Acute Uncomplicated Falciparum Malaria with ArtemetherLumefantrine in Non-immune Populations: A Safety, Efficacy, and Pharmacokinetic Study. Am J Trop Med Hyg. 2008; 78(2): 241-247.
- Ulvestad M, Skottheim IB, Jakobsen GS, Bremer S, Molden E, et al. Impact of OATP1B1, MDR1, and CYP3A4 expression in liver and intestine on interpatient pharmacokinetic variability of atorvastatin in obese subjects. Clin Pharmacol Ther. 2013; 93(3): 275-82.
- Rahmioglu N, Heaton J, Clement G, Gill R, Surdulescu G, et al. Genetic epidemiology of induced CYP3A4 activity. Pharmacogenet Genomics. 2011; 21(10): 642-51.
- Cai N, Li B, Huang X, Xu K, Feng H, et al. A non-invasive CYP3A4 biomarker and body mass index predict cyclosporine dosage requirements in Chinese renal transplant recipients. Pharmazie. 2015; 70(12): 815-8.
- Luo X, Zhu L, Cai N, Zheng L, Cheng Z. Prediction of tacrolimus metabolism and dosage requirements based on CYP3A4 phenotype and CYP3A5*3 genotype in Chinese renal transplant recipients. Acta Pharmacologica Sinica. 2016; 37: 555-560.
- Lefèvre G, Thomsen MS. Clinical Pharmacokinetics of Artemether and Lumefantrine (Riamet®) Clin Drug Investig. 1999; 18(6): 467-480.
- Food and Drug Administration. Clinical pharmacology and biopharmaceutics review: NDA 22-268- Artemether 20 mg/Lumefantrine 120 mg. 2008. http://www.accessdata.fda.gov/drugsatfda_docs/nda/2009/022268s000_ClinPharmR.pdf.