
Journal of Clinical Images and Medical Case Reports
ISSN 2766-7820
Case Report - Open Access, Volume 2
Children are victims of industrialization and commercialization of early feeding practices: A review of obesity in preschool children in Egypt
Ayoub Al-Jawaldeh1; Azza Abul-Fad2*
1 Regional Advisor Nutrition, Eastern Mediterranean Office- World Health Organization.
2 Professor of Pediatrics, Faculty of Medicine, Benha University, Egypt.
*Corresponding Author: Azza Abul-Fad
Professor of Pediatrics, Faculty of Medicine,
Benha University, Egypt.
Email: azza_abulfadl@yahoo.com
Received : Jun 15, 2021
Accepted : Jul 23, 2021
Published : Jul 29, 2021
Archived : www.jcimcr.org
Copyright : © Abul-Fad A (2021).
Abstract
Introduction: Obesity Is Global Problem Which Begins From Early Childhood. Early Exclusive Breastfeeding (EBF) without foods or Milk Formula (MF) before 6 months, with continued breastfeeding for two years are optimal feeding practices.
Aim: To review studies conducted to assess the nutritional status of preschool children with a focus on obesity and stunting and their association with EBF vs MF feeding.
Methods: We used online search engines of the Egyptian university libraries consortium (www.eulc.edu) to search for studies on overweight, obesity stunting and wasting in preschool children. We identified 919 theses that were filtered to 32 studies then to 18 theses fitting the criteria of the study. Analysis of the pooled data was done for the studies with children who were EBF (2 studies) vs children who were exposed to MF (16 studies) by age and sex.
Findings: Pooled analysis for children aged 6-59 months among MF vs. EBF studies as follows: overweight 5.4% vs. 3.45%, obesity 13.8% vs. 5.65%, stunting 21.6% vs. 1.15% and wasting 9.7% vs. 0.85% respectively. Obesity and overweight were higher in males in both studies, whereas stunting and wasting were higher in females in both studies (ages 0-72 months). Early and extended MF feeding, foods before 6 months of life, chips and canned drinks were prominent risk factors for obesity. Large family size was associated with obesity and short birth interval with stunting. Colostrum feeding, longer duration of breastfeeding, fruits and vegetables were protective. Obese children showed clinical signs of anemia, vitamin A and D deficiency, severe asthma and developmental delay.
Conclusions: Obesity and MF feeding beyond 6 months and well into 5 years of age threaten child health. Policies and legislations are needed to control, counter and monitor marketing tactics supported by guiding messages.
Keywords: Obesity; overweight; stunting; wasting; fast foods; breastfeeding; birth spacing; child development; infancy; preschool children; anthropometry; growth.
Citation: Al-Jawaldeh A, Abul-Fad A. Children are victims of industrialization and commercialization of early feeding practices: A review of obesity in preschool children in Egypt. J Clin Images Med Case Rep. 2021; 2(4): 1244.
Introduction
In 2020, globally, 149.2 million children under the age of 5 years of age were stunted, 45.4 million wasted, and 38.9 million overweight. The number of children with stunting may be declining as UNICEF/WHO/World Bank report that two-thirds of countries in all regions are making some improvements except for Africa. Also 45.4 million children under 5 are affected by wasting, of which 13.6 million are severely wasted and the condition is being exacerbated by the COVID-19 crises [1]. Of concern is the rising problem of overweight and obesity which is more challenging as about half of all countries have experienced no progress or are worsening especially that adiposity persists throughout a lifetime especially with the COVID-19 lockdown that potentiates sedentary life and overeating of unhealthy foods under the effect of marketing. In one country, decrease in physical activity during the pandemic was reported in 28 per cent of children aged 3 to 5 years, while increases in snack with high sugar, salt and fat were reported in 19 per cent of children in the study [2].
Early Exclusive Breastfeeding (EBF) for 6 months and Continued Breastfeeding (CBF) for two years or more are recommended by UNICEF and WHO as the optimal feeding practices [3]. EBF ensures optimal development of the immune system whereas FM predispose to immune diseases leading to high morbidity and mortality [4,5]. Early and prolonged industrialized formula milk (FM) feeding practices have been shown to play an important role in predicting or predisposing to obesity and its associated morbid medical complications [6]. Action has been taken by WHO to limit, control and guide the inappropriate marketing of these product [7,8]. Despite such efforts products as followon milks (FOM) after 6 months and growing up formula (GUF) at 1-5 years continue to be consumed as a continuum of early FM. Moreover, MF and baby foods, introduced in the early months of life, before 6 months predispose to health and nutritional problems [9].
Egypt is a developing country situated in the African continent and is the gatekeeper to Asia and Africa, sharing with Mediterranean and African countries common life styles and dietary habits. The nutritional status varies across the country and is influenced by poverty as well as cultural factors. However recent marketing of MF has been the drive to the changing patterns of feeding among children despite poverty. The percent children living in poverty is highest in rural UE (53%) compared to 19.0% in rural Lower Egypt (LE), 12% in urban UE, 4% in urban LE and 9% in urban governorates [10]. UE is a community of rigid traditional cultures who are not open to change and have the highest prevalence of stunting and wasting [11]. Whereas children in LE are open to Westernized lifestyles of marketed fast foods, packed snacks and canned beverages and thereby vulnerable to overweight and obesity, but stunting and wasting remain a problem in poor areas in LE leading to the double burden of malnutrition [10,12]. The challenge in any study is that overweight and obesity are so closely linked and cut offs and difficult to delineate when the adiposity of overweight can be serious and to mimic obesity and cause disease. It remains up to individual habits, susceptibility, hereditary factors and epigenetics to determine the outcome of these conditions. Importantly, numerous recent studies demonstrate that gene regulation of adiposity is influenced by maternal and early postnatal diet[13].
The aim of the present study is to perform an analytical review research on the nutritional status of preschool children Egypt over the past decades, with a focus on obesity and its association with breastfeeding and MF feeding practices in order to guide well informed recommendations for controlling this pandemic.
Subjects and methods
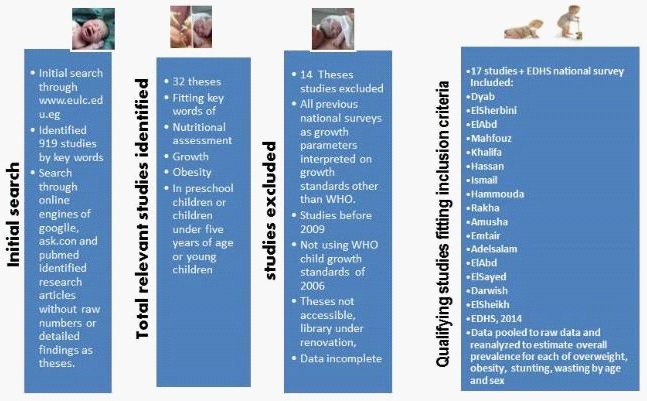
We searched for studies on overweight and obesity (OWOB) in children using online search engines primarily the Egyptian university libraries consortium (www.eulc.edu). Search was done based on the key words of preschool children, obesity, and nutritional status (see Figure 1)
Inclusion criteria: Preschool children or children under five years of age or within this age range who were screened through primary health care centers or day care nurseries through random selection for the purpose of assessing their nutritional status by measuring their weight, height and other parameters and their early feeding and food consumption habits using standardized methods. Children must be Egyptian and regions within Egypt. The study must be approved by the ethical committee of the university from which the research was done and supervised by a professional supervisory board from the faculty staff. The study must follow the standard anthropometric methods of interpretation of the recent WHO standards [11]. The sample includes males and females. Studies considered are those after the year 2009. Studies must be accessed to be qualitatively reviewed.
Exclusion criteria: Studies or data with children included beyond 6 years of age or covering one sex. Studies that consider only sick children or those who are suffering severe or debilitating conditions from early childhood or handicapped or case control studies, or before 2009 or not using Who standards were excluded.
Description of the review study process: The study is both a historical and analytical review that was carried out by the authors in this study. The process of the analytical review is illustrated in figure (1). Online search engines were used. Key words used were overweight, obesity, nutritional status, preschool children and growth. The main search was done through the Egyptian university libraries consortium (www.eulc.edu). Out of the 919 theses that were identified by the key words, 32 theses were initially identified. They were qualitatively evaluated and filtered so that 14 were excluded and 17 theses and one national survey were included [11] that fit the study criteria. The indices considered for stunting, wasting, overweight or obesity. We retrieved the relevant theses studies from Cairo, Ain Shams, Suez Canal, Benha, Alexandria, Mansoura and Menoufia universities. The 17 theses were thoroughly reviewed and their data was pooled and reanalyzed to estimate indices on nutritional status. The studies before 2006 used the NCHS/CDC/WHO International Reference Population and after this year used WHO references standards [14] the Egyptian standards of child growth [15]. The reference child standards that assess overweight and obesity include the Z-scores for weight for height (W/H Z-scores-2SD) and weight for age (W/A+2SD) and the Body mass index (BMI) (85th-95th for overweight and >95th for obesity) standard reference curves. The protocols for measuring weight and height followed the international standards for valid measurement of both height and weight in which weight is measured to the nearest gram and recumbent length is measured for children under age 2, and standing height is measured for all other children. The measures are fitted to the charts used by standard deviation units (SD) from the median of the international or national reference population. The national and local studies did not include North and South Sinai governorates.
Comparative analysis: Studies classified as per type of feeding: Two types of studies were included in the analysis. Pooled data was reanalyzed separately for studies that included children who were fed mixed breastmilk and/or formula versus studies based on children who were EBF or fully breastfed (i.e. water of decoctions given occasionally by spoon) from birth up to six months and never introduced any bottle or formula up to the date they were examined. The first group included 6 studies for stunting, overweight and obesity and 5 for wasting (including the national EDHS survey) for analysis by age group. The second group included 2 studies with a total of 2000 children aged 6-59 months. Comparative descriptive analysis was made between the groups by age group and sex.
Ethical considerations
Permissions to use the data in the theses was not required as the theses acceptability was regulated by the individual faculty libraries that allowed us to access and review them inside the library but not for public use. The supervisors were acknowledged in this article. Also a team of researchers in Sohag helped us to access theses from their library and they were acknowledged in the study.
Statistical analysis: The data were compiled on excel sheets and the data for stunting, wasting, overweight and obesity were compiled in the sheets. The numbers of cases (not prevalence rates) were pooled and summed to estimate the prevalence of each of the parameters by age group and by gender. Graphic presentations were used to make comparisons and associations of the reanalyzed data form the two types of studies (EBF vs non EBF) under examination.
Results
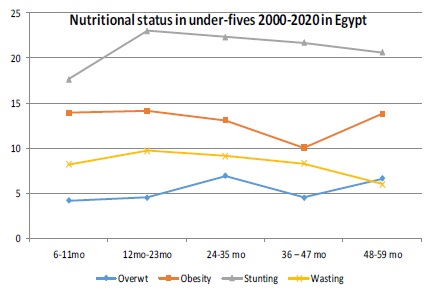
The theses filtered and fitting with the inclusion criteria of the review are listed in Table (1) which shows the prevalence rates of overweight, obesity, stunting and wasting by age groups of 12-23 months, 24-35 months, 36-47 months 48-59 months and 60-72 months) according to the national and local studies in Egypt. Studies that were included for overweight considered overweight W/A Z-score +2SD (only EDHS), all the other studies BMI 85th to 95th centile as cut-offs. Studies used WHO, 2006 standards. Six studies were included from 2014 to 2020 with an overall prevalence of overweight of 5.4% being highest at age 24-35 months (6.9%) being highest in rural LE in 2020 (14.9%) [16]. Studies that were included for obesity by W/H Z-score +2SD (only EDHS), BMI >95th centile as cut-offs (all other studies). Six studies were included for overall prevalence and 5 studies for analysis by age group from 2014 to 2020 with an overall prevalence of obesity of 12.6% being highest at age 12-23 months (14.1%). Studies that were included for stunting considered overweight H/A (or recumbent length for children under 2yrs) Z-score -2SD for all studies. Six studies were included that followed these guidelines from 2014 to 2020 with an overall prevalence of 21.6% and highest for age group 12-23 months (23%) and lowest for the 48-59 months of age (9.2%) and ranging from 34% (slum Alexandria) to 6.6%. Five studies were analyzed by age for wasting by W/H Z-score -2SD from 2009 to 2016 with an overall prevalence of 9.3% being highest at 12-23 months being highest in a study in rural LE (36%) compared to the national figure of 7.7% [11]. The values used were interpreted using the WHO growth standards of 2006 [14]. This is also shown in figure (2) which compares the indices by age group and shows the escalating rates in obesity vs the declining rates in stunting and wasting by age group.
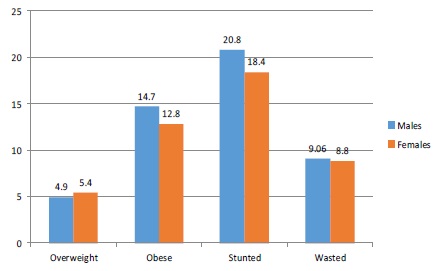
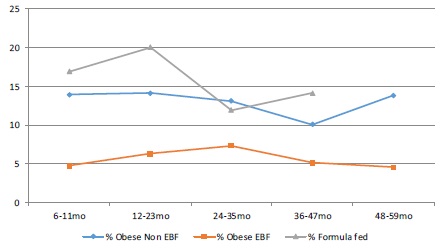
Table (2) and figure (2) present the studies from which the data for overweight, obesity, stunting and wasting were extracted and reanalyzed by sex (males and females) which included 15 studies. It showed that prevalence of overweight and obesity was higher in males and that stunting and wasting were higher in females. Table (3) presents a descriptive comparison between the group with studies including children who were not all EBF and the group with the two studies of children who were EBF. The comparison is made for age groups 6-11 months. 12-23 months, 24-35 months, 36-47 months and 48-60 months and for sex (males vs females) in both groups under study. All nutritional indices were several times higher in the non EBF vs. the EBF studies across all age groups and by sex. This is also shown in figures 4, 5 and 6 for obesity, stunting and wasting respectively which also show that the higher figures in the non EBF were running closely with the high MF rates in these studies. Figure 7 illustrates the relationship between nutritional indices and child poverty sourced from UNICEF, 2015 [12].
Discussion
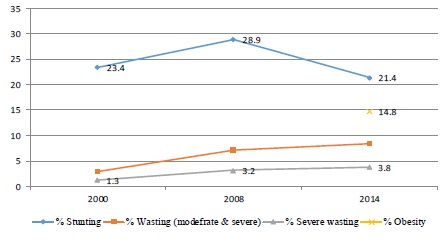
Before presenting the recent review studies that included overweight and obesity, we tried to review research in Egyptian universities that were conducted before the turn opf the century. One of the earliest studies in the review process of nutritional status of preschool children in Egypt was conducted by Rantisi in 1976 [17] in Alexandria who used the Wolanski values given by Jellife [18] in 500 preschool children (0-72 months) and showed that underweight was 3.4%. Underweight and wasting were the main concern in this decade. In the 1980s [19] a study of 608 young children attending outpatients in Alexandria showed that stunting was 20.5%, underweight 16.9% and wasting 22.6% using the Boston standards [20]. Underweight and wasting peaked at 12-18 months. In this period, no overweight or obese children were reported. Even in the decade that followed emphasis was not on obesity in this age, but stunting was an emerging problem. With the turn of the century in 2000, a study in Alexandria [21] reported that children with overweight and obesity wereas 4.2%, rising from 2.5% at 30-47 months to 6.2% at 48-60 months and underweight in 9.7% (6.1% at 30 -47 months and 14.2% at 48-60 months. Stunting was detected in 5% of the preschool children 3.0% at 30-47 months and 7.4% at 48-60%. Wasting was 5% (3.0% in the 30-47 months and 7.4% in 48-60 months aged preschoolers). Low socioeconomic status was significant for underweight, wasting and stunting (OR=3.1, 3.62 and 4.96 respectively at P<0.05) [21]. The latter study used the WHO/NCHS growth standards which tend to underestimate overweight and obesity compared to the new growth standards of WHO in 2006.The reported rates of overweight and obesity by EDHS using the NCHS system was 10.2% while it was 15% by the WHO, 2006. Hence the study in 2000 that reported a prevalence of 4.2% may have actually been at least one third higher. Two decades later in 2017, a study in Gharbia [22] reported that prevalence of stunting, wasting and underweight were 31.9%, 2.2% and 9.1% respectively, with severely stunted children (<-3SD) being 11.8%, indicating a horrendous rise in stunting probably attributed to the epidemics of the influenza virus, and SARS over this period that deprived children from eating poultry and eggs together with the political up rise in 2011 and the economic demise that followed [22]. The indices for wasting and underweight were higher in preschoolers below 36 months of age, and for stunting which was highest at 36- 47 months (36.3%). Stunting was higher in males (33.3%) compared to females (30.3%) while wasting and underweight were much lower in males (2.4% and 9.9%) than in females (2.1% and 8.2% respectively) [22].
The new millennium witnessed a gush of research that took into consideration overweight and obesity among preschool children as an emerging problem in both child health and medical practice. A study in 2008 [23] conducted in Cairo governorate for 513 preschool children aged (3-5 years) retrieved from child care centers reported that the prevalence of overweight by W/H was higher than obesity (11.9%vs. 5.5%). Overweight was higher in males than in females and obesity higher in females than males (12.8% in boys and 10.8% in girls for overweight and 3.5% in boys and 7.8% in girls for obesity. Prevalence of overweight, by BMI, was 10.9% (11% in boys and 10.8% in girls) and prevalence of obesity was 6.6% (4.3% in boys and 9.5% in girls) respectively. Underweight, was 0.6% (0% in boys and 1.3% in girls), wasting was 1.9% (2.5% in boys and 1.3% in girls) and stunting was 4.3% (2.8% in boys and 6.1% in girls) respectively. Overweight and obesity were clearly an emerging problem that had been in the dark for the past decade and had shown a sudden surge paralleling the steep rise in digital technology that grounded and invaded the minds and lives of these children with digital games and toys that interfered with their childhood development and made their bodies and mind captive to this technology [24]. However the low protein intake further encouraged the reliance on dairy products and carbohydrates that were feeding the rise in obesity in this period.
The EDHS [11] in 2014 was the first national survey to report overweight and obesity at 14.9%, as none of the previous EDHS national surveys considered these indices [25]. They reported minimal differences between males (15.3%) and females (14.3%). Stunting was strikingly higher in males (22.8%) than females (19.9%) in their survey. The prevalence of obesity was highest in urban LE (17.3%), urban LE (16.8%), rural LE (16.3%) and 14.7% in urban governorates, but lowest in Frontier (8.3%) and rural UE (11.9%). Stunting was highest in UE (29.8%) vs. Urban LE and urban governorates (19.0%). Wasting was 8.4% being highest in frontier and rural LE governorates (8.3% and 11.9%) vs. LE and urban governorates (17.3% and 14.7% respectively). The findings indicated that the burden of overweight and obesity was mostly in urbanized communities and thereby linked to the technology and digital marketing technologies that were prevailing in these regions [26]. Moreover it was linked with social class that could afford to purchase this technology as it was highest in the children of from families with highest quintiles of wealth (WQ4=15.0% and WQ5=17.7%) and lowest in WQ2 (12.8%). There was no difference in the prevalence of obesity by the level of education of the mothers of these children [11].
A study conducted in Sharkia governorate for 4-6 year old children in the period between 2008-2010 showed that one out of five children exhibited overweight or obesity in rural areas, while one out of four children exhibited overweight or obesity in urban areas [27]. Another study in Sharkia governorate in 2018 reported that prevalence at 24-71 months aged children was as follows: underweight (3%) overweight (19.8%) and obesity (10.6%) using the Egyptian growth standards [28].
A study in Cairo governorate in 2014 [29] for the 3-6 years age group reported that prevalence of stunting was 32.6% and underweight 17.8%. Obesity (assessed by W/H Z- score+2SD) was similar to the EDHS findings at 15% and was linked to higher class and higher maternal education [29].
Another study in the same time [30] in Mansoura City in LE showed that prevalence of obesity and overweight was more than double that reported by the national study being about one third of the studied sample (33%). Mother’s knowledge and feeding habits played an important role in the problem and they recommended that education programs for prevention and control of obesity should target mothers and caregivers [30].
However later in the second decade of the 2000s, obesity started manifesting and rising even in rural areas. This was an alarming sign as it signaled the spread of the epidemic of obesity throughout the country doubling the burden of under and over nutrition in these underprivileged areas. The phenotype of the stunted and stout child and adult became a common finding in the fast food outlets in the urbanized communities. A study by the team in High Institute of Public Health (HIPH) in Alexandria University in the rural area in Kafr ElSheikh governorate in LE (2016) [31] reported that prevalence of obesity was 23.65%, stunting 28%, being moderate in 22.5% and severe in 5.5% of preschool children, thus typifying the stunted stout child phenotype of the new century. Stunting was highest in the 24-35 months with more severe stunting that declined at 36-47 months, so that at 60-72 months there were no severely stunted children and moderately stunted were 5.7%. Males were more stunted than females. Severe wasting was 18.6% and moderate wasting 6.4% and the former was highest in the 4 year old (34.2%), while the latter was highest in the 12-23 months (25%) and 24-35 months (50%) and more in males as shown in tables (1 and 2) [31]. Although it may appear that stunting declines with age, wasting on the other hand potentiates the rebound stunting evident in later childhood and puberty [13]. We postulate that early wasting masks the long standing micronutrient deficiency states which become accentuated with obesity resulting in the short and stout adolescent and adult.
The same team in the HIPH confirmed the above findings. A study in 2016 in an urban area in Alexandria [32] reported prevalence in preschool children of overweight was 3.3% and obesity >95th centile was 17.4% with severe obesity >97th centile 13.7%. Overweight was prevalent more in males (66.1%) and at 24-35 months. Whereas stunting was 19.3% still high and peaked at 12-23 months age group (34.5%) and at 48-59 months (27.6%), mostly in males (63.6%). Moderate wasting still persisted and was 14.3% and peaked at 12-23 months age group (51.2%) and at 48-59 months (20.9%) and severe wasting (-2 to -3 Zscore) was more at age 24-35 months (30.3%). Wasting was more in males (62.8%). Hence the double burden of malnutrition was characteristic of urbanized areas too, with severe forms of obesity starting to emerge even in these very young children with superadded stunting and wasting [32].
On the other hand the same research team in HIPH showed that in rural settings in Alexandria [33] that studied the nutritional status of preschool children reported that both overweight and obesity were 8% and obesity alone >97th centile was 4.3%. One half of the overweight and obese were among the 48-59 months of aged (55.6%) and mostly among the males (66.7%). Stunting was 12% and peaked at 12-23 months age group (27.8%). Wasting was 12% and mostly at 24-47 months (63.9%) and in males (69.2%). These two studies in two different region in Alexandria demonstrated that more severe obesity was a characteristic finding of urban Alexandria (13.7%) vs rural Alexandria (4.3%) reflecting the role of urbanization and differences in exposure to dietary practices between urban and rural communities [32,33].
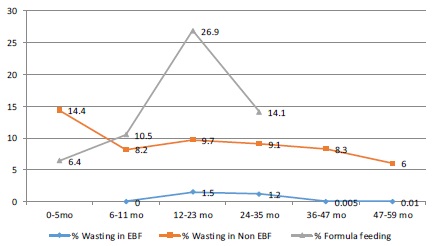
These patterns brought the attention of research workers in Alexandria later in 2019 [34] to study this pattern in relation to formula feeding. They studied 796 children 3-5 years attending day care centers in Alexandria. They reported that 14% of the children were wasted and 10% were obese and less than one quarter (22%) overweight. Less than one fifth (17.1%) of them were bottle-fed with a mean duration of 17.08 ± 7.70 months. They concluded that the prolonged MF feeding was linked to the emerging problem of obesity. This is demonstrated by figures (5, 6 and 7) in our results, which demonstrate the link between the increasing use of MF beyond the first and even the second year of life indicating the active marketing of the so called “Growing Milks” to the community as a continuum of MF in infancy leading to the obesity of overconsumption [35].
A study in rural Qaluibiya in 2017 showed that the prevalence of stunted growth in preschool children of the studied group was 13.32%. Stunting was more in large sized family (over 3), child order and family history of short stature, maternal anemia during pregnancy and no iron supplementation, cesarean section and incubator care [36].
By the end of the second decade a new alarming trend in obesity emerged as they showed that although prevalence of obesity was 6% and overweight 15% yet prevalence was 13.3% in those aged 2-3 years, 46.7% in those aged 3-4 years of age and 40% in those aged 4-5 years [16]. This indicated that obesity was creeping to rise in older ages. The sample was small (248 2-5 years aged children) in rural Tala district in the north of Menoufia governorate (LE). Prevalence was again higher among males 80% vs females 20% and linked with high levels of education (86.7%) P=0.003, middle or low socioeconomic status (p=0.05) [16]. The higher rates of obesity among males is documented in other middle income countries in our region, where in Iran prevalence in preschool children was reported as 9.6% in males and 6.3% in males which are close to many of our studies in this period [37].
In 2021, a study [38] in the delta region of LE in Gharbia and Beheira including 445 preschool children <6 years of age showed that overweight and obese (OWOB) were 11.5%, and (8.1%) had stunted growth, while (2%) had double burden of stunted growth and OWOB i.e. stoutness. The majority of children with OWOB and those with the double burden were girls aged 60 - <72 months. On the contrary, stunting was common in boys and in the age group between 48 - <60 months. Approximately, two thirds (66.7%) of children who were suffering from stunted growth or the double burden were living in rural areas, but 70.6% of OWOB children were from urban areas. This study confirmed the trends of migration of obesity from urban areas into rural increasing the burden of malnutrition and chronic diseases as diabetes mellitus as shown in a study in India [39] and bronchial asthma as shown in a study in Ismailia [40].
Figure (7) shows that child poverty was running closely in parallel with the indicators of malnutrition for wasting and stunting indicating that much of these problems are linked to poverty and its adjuncts (ignorance and vulnerability) that can make mothers be at risk of misinformation and be misled by the fake messages for marketing baby foods and milks. Large family size and short birth intervals characterize communities living in poverty. Studies seemed to show that obesity was associated with large family size but not with birth intervals. The EDHS study in 2014 showed that obesity was high in those with birth intervals of +48 months (15.0%) and 24-47 months (14.7%) compared to <24months (13.5%). In Gharbia governorate [38] about half of families of children with double burden (55.6%) had more than 3 children in the family and the affected child order came after the third. More than three quarters of families had large household size (>5) and one third had unsuitable houses. About one quarter of these families had unsanitary water supply, unsanitary sewage disposal, and insufficient food. Electricity was not available for 11.1% of these families. The study in Cairo [29] reported that obesity was linked to families with over 3 children (P=0.000) [41].
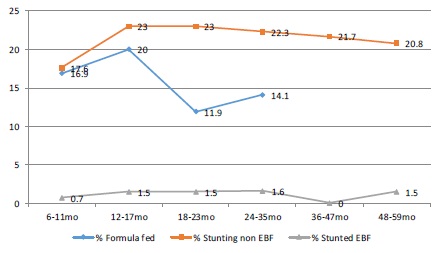
Regarding Breastfeeding and malnutrition in the preschool children, two studies were conducted by our team that assessed the nutritional status of children 6-59 months who were all EBF in the first 6 months of life. The studies were in Gharbia [42] and in Menoufia [43] for a total of 2000 children. Overweight was detected in 4.8% an2.2% respectively and obesity in 7.7% and 3.6%. Obesity was highest in 48-59 age groups in Gharbia (9.3%) and 6.5% in the second year of life in Menoufia. Figure (4) compares the prevalence rates of overweight and obesity by age in these two studies with the other studies that included children who were formula fed and with the rates of formula milk feeding by age. Stunting was 1.7% in Gharbia and 0.6% in Menoufia which was much lower than the other studies as shown in figure (5). Wasting was as also lower in the EBF studies with EBF vs. those with formula fed (1.1% in Gharbia and 0.6% in Menoufia) as shown in figure (6). The high obesity rates in the 4-5 year old children in Gharbia was attributed to dietary patterns of feeding milks and diet high in carbohydrate and sugars. The malnutrition rates in the other studies were closely paralleling the rates of milk formula intake.
Early initiation of breastfeeding and colostrum feeding were shown to be protective against obesity in Alexandria [32,33] and in Kafr ElSheikh (LE) [31]. Another study in Gharbia [29]demonstrated that colostrum feeding was significantly associated with decreased prevalence of stunting and underweight. Children not receiving colostrum had 3.45 times risk of underweight relative to those receiving colostrum. The study in Kafr ElShekh [31] showed that early vs late initiation of breastfeeding and longer duration of breastfeeding was protective against obesity. While longer periods of formula feeding and early introduction of foods at 3 months and abrupt weaning off the breast were associated with obesity (p=<0.05) [31]. Another study showed that all the obese children had received formula milk with or without breastmilk and continued formula milk feeding up to 18 months of age in the obese. While the more recent reviewed study in Sohag [44] showed that obesity was higher in MF fed (23.07%) and that none of non-formula fed were obese P<0.03). The study showed that 19.8% of the normal children were exposed to formula whereas 31.6% of the overweight and 28.6% of the obese were exposed to FF. In the Port-Said study [46] obesity was associated with MF and mixed feeding vs. EBF children. This was reported also by other studies [21,45]. While the study in Port Said showed that starting MF before 20 days of age significantly increased the risk of obesity [46].
The Suez Canal university research team [47] highlighted in their research that early age of weaning (before 3 months) and carbohydrates as a main type of weaning food were significantly associated with overweight and obesity in preschool children and that EBF protects against obesity (P<0.03). This was substantiated by other studies [46]. A study in Alexandria by the Faculty of Nursing team of research showed that normal non-obese children had higher rates of breastfeeding, i.e. in the normal children 44% were breastfed (BF) while 14.6% were FF, while in the overweight and obese 38.9% were BF vs. 26.2% were FF [34].
The Tanta university team of researchers in Gharbia [38] reported that less than half of children in the double burden group (44.4%) and more than one third of overweight and obese children were bottle-fed, while about one third (33.3%) of children in the double burden group were BF and started BF within 24 hours. EBF was not practiced by less than half of double burden children, overweight and obese group and one quarter of stunted children were not EBF and about one quarter of double burden children were BF for less than 4 months. More than half of double burden group (55.6%), about two thirds of OWOB group (64.7%) and (61.1%) of stunted children started weaning before the age of 6 months. Hence early termination of BF was linked to the double burden group and overweight and obese children [38].
In the early 1980s malnutrition and diarrheal disease attributed to bottle feeding and early cessation of breastfeeding peaked under the effect of the aggressive marketing for BMS around the world with its devastating effects in developing countries. The Egyptian Ministry of Health officials responded early to this crises by giving full support to the International Code of marketing of breastmilk substitutes (The Code) and released ministerial decrees in 1979 and 1981 to prohibit the marketing of these products in health facilities and public places [49]. However breastfeeding practices remained poor and were linked with malnutrition. Egypt was one of 12 flagship countries to adopt the Ten steps of the Baby-friendly Hospital Initiative in the early 1990s and released a decree through the undersecretary of primary health care to promote Baby friendly practices and prohibit advertising of Breast-Milk Substitutes (BMS) in all health facilities. By the mid nineteen nineties (1995) Egypt declared 126 of its health facilities providing maternity and neonatal care services to mothers around the country as Baby-friendly and represented the lead country with these figures in the Eastern Mediterranean region and around the world [50]. However in the decade that followed Baby-friendly hospitals reversed their practices and the Ten steps were no longer implemented this led to a decrease in the early initiation and increase in the early introduction of MF and decrease in EBF in the first six months of life from 54% to 39% BF for into the second year fell from 40% to 20%. Our study showed that MF took the upper hand in the second year and beyond probably under the effect of Growing Up Milks (GUM) (Figures 4,5,6). Hence much of the obesity is linked to the extended MF feeding for over 2 years that encourages consumption of large amounts of high fat milk. This is supported by the review studies that showed that many of the mothers were bottle feeding after 18 months and well into the third year of life. This could be attributed to the aggressive marketing for the so called GUM. Also a high percentage of children were fed packed potato chips (71.1%) and canned sugary drinks on daily or weekly basis 57.9% [31-33]. These were significantly associated with overweight and obesity. Sedentary life with less physical and outdoor activities was more common in the obese group. The studies also showed that hereditary factors played a role and that overweight and obese parents had overweight and obese children. However this could have been due to the tendency of these families to consume large quantities in their family meals and consequently over feed their children [51].
Obesity was shown by several studies to be associated with micronutrient deficiency states. Anemia was reported to more prevalent in the obese in study carried out in Kafr ElSheikh [31]. The overall prevalence of moderate anemia was 58%, mild 27% and normal 15%. Vitamin A deficiency detected by Xerosis in the eye (17 cases) and Bitôt spots (18 cases) was significantly higher in the obese (50.0%, 52.9% respectively) than normal weight preschoolers (22.2%, 29.4% respectively) p=0.02 [31].
In rural Alexandria the preschool obese children had a mean hemoglobin (Hb) of 11gm/dl with a prevalence of anemia of 75% vs 67.5% in the normal preschoolers under study. VAD was with Xerosis in the eye was reported in 2.7% and Bitôt spots in 23.3% in the whole population under study. VAD as Bitôt spots was detected in 3 (4.3%) of obese and 3(12%) as follicular hyperkeratosis out of a total of 70 (23.3%) and 25 (8.3%). Also 2 and 5 of the obese children showed signs of VDD (broadening of the epiphysis and bowing of the legs) [33]. In urban Alexandria [32] 20.4% of obese children presented with xerosis, 28.6% keratomalacia, 22% Bitôt spots and 11.1% follicular hyperkeratosis. Also among the obese VDD clinical signs were seen as bowing of the leg in 21.4%, bossing of the head in 23.7% and craniotabes in 33.3%. Obese children also showed signs of vitamin B complex deficiencies as angular stomatitis in 21.1% and atrophied glazed tongue in 29.6% [32]. In Gharbia showed that a 8.3% of stunted children had history of rickets and 11.1 % of double burden. Less than half of double burden (44.4%) and about one third of stunted children (33.3%) had history of anemia that is not yet treated. Pallor in the studied children, more than three quarters of double burden group (77.8%), more than half of overweight and obese group (52.9%) and (55.6%) of stunted group vs. one third of normal group (38.7%) who had mild pallor [38]. A number of studies examined the health status of preschool children and showed that there was a positive link between early feeding status and health status and that MF feeding, daily and unlimited access to snacks and canned juices were significantly higher in the obese children [52-54]. Studies showed that poor parental knowledge of optimal dietary practices [55] which had a negative effect in nutritional indices. Sedentary life and inactivity were shown by most of the reviewed studies in all regions in UE and LE [55-57]. Unfortunately, poor attitudes of care takers in nursery day care centers towards optimal nutritional needs of these children, was described in some studies. They recommend training them and incentivizing them to raise nutritional awareness to parents and children [58,59]. In addition care taker in day care nurseries resorted to punishing children by depriving them of sports in many cases, hence the need for intervention programs in this respect.
Table 1: List of reviewed literature for nutritional status (Overweight, obesity, stunting and wasting) of children under-five presented by age group after excluding studies before 2009 which did not use the updated WHO growth charts:
Study |
6-11mo |
12-23mo |
24-35 mo |
36 – 47 mo |
48-59 mo |
Sample |
# overwt |
% overwt |
|||||
|
Total |
Ovwt |
Total |
Ovwt |
Total |
Ovwt |
Total |
Ovwt |
Total |
Ovwt |
|||
Overweight W/A Z-Score +2SD (EDHS) BMI 85th -95th centile (other studies) |
|
|
|
|
|||||||||
Ismail, 2014 |
|
|
|
|
1119 |
112 |
1281 |
54 |
51 |
26 |
2400 |
168 |
7.0 |
EDHS, 2014 |
1556 |
65 |
2872 |
132 |
2810 |
132 |
2826 |
90 |
2340 |
77 |
12404 |
496 |
4.0 |
Amushi, 2016 |
|
|
47 |
2 |
89 |
3 |
67 |
4 |
52 |
6 |
300 |
21 |
7.0 |
Emtair, 2016 |
|
|
108 |
5 |
62 |
1 |
63 |
2 |
67 |
2 |
300 |
10 |
3.3 |
AbdelSalam, 2016 |
|
|
0 |
0 |
0 |
0 |
0 |
0 |
0 |
0 |
311 |
20 |
6.4 |
Megahed, 2020 |
|
|
0 |
0 |
59 |
4 |
66 |
15 |
123 |
18 |
248 |
37 |
14.9 |
Total |
1556 |
65 |
3027 |
139 |
4221 |
295 |
4373 |
195 |
2733 |
180 |
15910 |
874 |
5.4 |
Prev by age |
|
4.2 |
|
4.5 |
|
6.9 |
|
4.5 |
|
6.6 |
|
5.4 |
|
Obesity (BMI>95th centile) Only EDHS (W/H+2SDS) |
|
|
|
||||||||||
Study |
Pop. |
#Ob |
Pop. |
#Ob |
Pop. |
#Ob |
Pop. |
#Ob |
Pop. |
#Ob |
Pop. |
#Ob |
% Ob. |
Ismail, 2014 |
|
|
|
|
1119 |
86 |
1281 |
28 |
|
|
2400 |
114 |
4.8 |
EDHS, 2014 |
1556 |
216 |
2872 |
409 |
2810 |
438 |
2826 |
393 |
2340 |
332 |
12404 |
1788 |
14.4 |
Abdel Salam, 2016 |
|
|
0 |
0 |
0 |
0 |
0 |
0 |
0 |
0 |
311 |
70 |
22.5 |
Amushi, 2016 |
|
|
47 |
1 |
89 |
3 |
67 |
4 |
52 |
6 |
300 |
18 |
6.0 |
Emtair, 2016 |
|
|
108 |
17 |
62 |
13 |
63 |
0 |
67 |
12 |
300 |
42 |
14 |
Megahed, 2020 |
|
|
0 |
0 |
59 |
2 |
66 |
7 |
123 |
6 |
248 |
15 |
6.0 |
Total |
1556 |
216 |
3027 |
427 |
4139 |
542 |
4303 |
432 |
2582 |
356 |
15607 |
1973 |
12.6 |
% Obese |
|
13.9 |
|
14.1 |
|
13.1 |
|
10.04 |
|
13.8 |
|
12.6 |
|
Stunting (St) Z-score +2SD |
|||||||||||||
Study |
Pop. |
# St |
Pop. |
# St |
Pop |
# St. |
Pop |
# St. |
Pop |
# St |
Total |
Total |
% St |
Dyab, 2009 |
|
|
|
|
|
|
184 |
15 |
251 |
12 |
500 |
33 |
6.6 |
Abdel Salam, 2016 |
|
|
98 |
13 |
126 |
44 |
59 |
18 |
20 |
8 |
300 |
83 |
27.7 |
EDHS, 2014 |
1556 |
274 |
2872 |
660 |
2810 |
607 |
2826 |
636 |
2340 |
503 |
12404 |
2680 |
21.6 |
Emtair, 2016 |
|
|
108 |
36 |
62 |
25 |
63 |
15 |
16 |
26 |
300 |
102 |
34 |
Amushi, 2016 |
|
|
47 |
10 |
89 |
13 |
67 |
10 |
52 |
4 |
300 |
37 |
12.3 |
Harraz, 2020 |
|
|
0 |
0 |
0 |
0 |
0 |
0 |
0 |
0 |
200 |
35 |
17.5 |
Total |
1556 |
274 |
3125 |
719 |
3087 |
689 |
3199 |
694 |
2679 |
553 |
13646 |
2929 |
21.5 |
% stunted |
|
17.6 |
|
23.0 |
|
22.3 |
|
21.7 |
|
20.6 |
|
21.5 |
|
Wasting (W/H Z-Score -2SD) |
|
|
|
|
|
||||||||
Wasting |
Pop. |
# Wt |
Pop. |
# Wt |
Pop. |
# Wt. |
Pop. |
# Wt. |
Pop. |
# Wt |
Total pop |
Total wasted |
% wasted |
Dyab, 2009 |
|
|
0 |
0 |
0 |
0 |
184 |
31 |
251 |
10 |
500 |
51 |
10.2 |
EDHS, 2014 |
1556 |
127 |
2872 |
258 |
2810 |
236 |
2826 |
217 |
2340 |
133 |
12404 |
971 |
7.8 |
Abdel Salam, 2016 |
|
|
98 |
12 |
126 |
26 |
59 |
15 |
20 |
3 |
311 |
112 |
36.0 |
Emtair, 2016 |
|
|
108 |
33 |
62 |
15 |
63 |
12 |
67 |
16 |
300 |
76 |
25.3 |
Amushi, 2016 |
|
|
47 |
9 |
89 |
11 |
67 |
15 |
52 |
9 |
300 |
54 |
18.0 |
Total |
1556 |
127 |
3297 |
322 |
3230 |
293 |
3554 |
296 |
3039 |
183 |
14676 |
1340 |
9.3 |
% Wasted |
|
8.2 |
|
9.7 |
|
9.1 |
|
8.3 |
|
6.0 |
|
9.3 |
|
Table 2: Nutritional status assessed for overweight (9 studies), obesity (8 studies), stunting (7 studies) and wasting (7 studies) of children aged 6 to 72 months in males and females in studies including children who were not exclusively breastfed (variable age groups from 0-72 months):
Study |
|
Males |
Females |
Total |
||||||
|
|
Total Sample |
# Overwt |
% Overwt. |
Total sample. |
Total Overwt. |
% Overwt |
Total population |
Total overweight |
% obese |
Over weight (W/L Z-score +2SDS) EDHS used W/A for overweight |
||||||||||
Ismail, |
2014 |
1157 |
69 |
6.0 |
1243 |
99 |
8.0 |
2400 |
168 |
7 |
EDHS, |
2014 |
7034 |
295 |
4.2 |
6567 |
263 |
4.0 |
13601 |
558 |
4.1 |
Amusha, |
2016 |
153 |
11 |
7.2 |
147 |
10 |
6.8 |
300 |
21 |
7.0 |
Emtair, |
2016 |
172 |
5 |
2.9 |
128 |
5 |
3.9 |
300 |
10 |
3.3 |
Abdel Salam, |
2016 |
170 |
8 |
4.7 |
141 |
12 |
8.5 |
311 |
20 |
6.4 |
Hassan, |
2015 |
160 |
24 |
15 |
125 |
18 |
14.4 |
285 |
42 |
14.7 |
Mahfouz, |
2016 |
79 |
24 |
30.4 |
76 |
25 |
32.8 |
155 |
49 |
31.6 |
Megahed, |
2020 |
129 |
10 |
7.75 |
119 |
27 |
22.7 |
248 |
100 |
|
Total |
|
9054 |
446 |
4.9 |
8546 |
459 |
5.4 |
17600 |
968 |
5.4 |
Obesity (Body Mass Index Z-score +2SDS) |
||||||||||
Khalifa, |
2012 |
124 |
56 |
45.1 |
76 |
44 |
57.9 |
200 |
100 |
50 |
Ismail, |
2014 |
1157 |
82 |
7.1 |
1243 |
32 |
2.6 |
2400 |
114 |
4.8 |
EDHS, |
2014 |
7034 |
1076 |
15.3 |
6567 |
939 |
14.3 |
13601 |
2015 |
14.8 |
Hassan, |
2015 |
160 |
7 |
4.4 |
125 |
10 |
8.0 |
285 |
17 |
6.0 |
Mahfouz, |
2016 |
79 |
31 |
39.2 |
76 |
23 |
30.3 |
155 |
54 |
34.8 |
Amusha, |
2016 |
153 |
10 |
6.5 |
147 |
6 |
4.08 |
300 |
16 |
5.3 |
Emtair, |
2016 |
172 |
29 |
16.9 |
128 |
23 |
17.9 |
300 |
52 |
17.3 |
Abdel Salam, |
2016 |
170 |
43 |
25.3 |
141 |
27 |
19.1 |
311 |
70 |
22.5 |
Megahed, |
2020 |
129 |
12 |
9.3 |
119 |
3 |
2.5 |
248 |
15 |
6.05 |
Total |
|
9178 |
1346 |
14.7 |
8622 |
1107 |
12.8 |
17800 |
2453 |
13.8 |
Stunting (height forage H/A Z-score-2SDS) |
||||||||||
Abdel Salam, |
2016 |
170 |
53 |
31.2 |
141 |
34 |
24.1 |
311 |
87 |
27.9 |
EDHS, |
2014 |
7034 |
1603 |
22.8 |
6567 |
1307 |
19.9 |
13601 |
2910 |
21.4 |
Emtair, |
2016 |
172 |
59 |
34.3 |
128 |
43 |
33.6 |
300 |
102 |
34 |
Amusha, |
2016 |
153 |
17 |
11.1 |
147 |
25 |
17.0 |
300 |
42 |
14 |
El-Sherbiny, |
2018 |
165 |
12 |
7.3 |
178 |
13 |
7.3 |
343 |
25 |
7.3 |
Megahed, |
2020 |
129 |
10 |
7.75 |
119 |
27 |
22.7 |
248 |
100 |
40.3 |
Total |
|
7823 |
1754 |
22.4 |
7280 |
1449 |
19.9 |
15103 |
3266 |
21.6 |
Wasting (W/L Z-score -2SDS) |
||||||||||
Dyab, |
2009 |
285 |
39 |
13.6 |
215 |
12 |
5.6 |
500 |
51 |
10.2 |
EDHS, |
2014 |
7034 |
590 |
8.4 |
6567 |
558 |
8.5 |
13601 |
1148 |
8.4 |
Abdel Salam, |
2016 |
170 |
34 |
20.0 |
141 |
24 |
17.0 |
311 |
58 |
18.6 |
Emtair, |
2016 |
172 |
47 |
27.3 |
128 |
29 |
22.6 |
300 |
76 |
25.3 |
Amushi, |
2016 |
153 |
28 |
18.3 |
147 |
21 |
14.3 |
300 |
49 |
16.3 |
Megahed, |
2020 |
129 |
10 |
7.75 |
119 |
27 |
22.7 |
248 |
100 |
40.3 |
Total |
|
7943 |
748 |
9.4 |
7317 |
671 |
9.2 |
15260 |
1482 |
9.7 |
Table 3: Comparison of pooled data for studies with formula fed (FF) children versus studies for children not exposed to FF (exclusively breastfed 0-6 months) with regards overweight, obesity, stunting and wasting by age group and sex of children 6-59 months of age:
Age/months/ sex |
6-11 |
12-23 |
24-35 |
36 – 47 |
48-59 |
Males |
Females |
Population |
Type of Study |
Pooled population estimates by age and sex: |
Total |
||||||
EBF studies |
574 |
718 |
247 |
196 |
265 |
996 |
1004 |
2000 |
% Overweight |
5.4 |
2.4 |
2.4 |
1.5 |
4.5 |
5.5 |
4.3 |
3.45 |
% Obese |
4.7 |
6.3 |
7.3 |
5.1 |
4.5 |
4.8 |
3.9 |
5.6 |
% Stunting |
0.7 |
1.5 |
1.6 |
0.0 |
1.5 |
1.6 |
2.1 |
1.15 |
% Wasting |
0 |
1.5 |
1.2 |
0.005 |
0.01 |
0.9 |
0.8 |
0.85 |
|
Pooled population estimates and ranges by age and sex: |
|||||||
Non EBF |
1556 |
3125 |
3087 |
3199 |
2679 |
|
|
13646 |
% Overweight |
4.2 |
4.5 |
6.9 |
4.5 |
6.6 |
5.7 |
6.06 |
5.4 |
% Obese |
13.9 |
14.1 |
13.1 |
10.04 |
13.8 |
14.7 |
12.8 |
13.8 |
% Stunting |
17.6 |
23.0 |
22.3 |
21.7 |
20.6 |
20.8 |
18.4 |
21.6 |
% Wasting |
8.2 |
9.7 |
9.1 |
8.3 |
6.0 |
9.06 |
8.8 |
9.7 |
Percent (%) Overweight: weight for recumbent length or standing height (W/H) Z-score +2SDS, % Obese: Body mass index (BMI) Z-score +2SDS, % Stunting: height forage H/A Z-score-2SDS, % Wasting: W/H Z-score -2SDS according to WHO Child Growth standards, 2006. EDHS used W/H Z-score +2 SDS for obesity as BMI was not estimated. All other studies after 2009 used WHO BMI standards >95th centile for estimating obesity.
Limitations
Studies on prevalence of obesity in the preschool age group were limited in Egypt. Only after 2014 that research work was intensified in this field. In-depth studies are needed to examine the relationship between preschool obesity and obesity later in life. These require longitudinal cohort studies. The link between early MF and the amounts consumed was not examined and there was poor focus on EBF. Although BF appears to be protective, it is the intensity of feeding formula milk especially the follow-on formula and GUM that need to be examined in more detail in relation to overweight, obesity and the associated nutritional problems of stunting and micronutrient deficiencies states linked with reliance on milks and dairy products rather than on fresh foods. More important is to examine how food snacks and sugary drinks increase their milk intake i.e. whether there is a correlation between high milk intake and high intake of salted snacks and canned sweetened beverages. Also no qualitative studies that could go in-depth with the root causes of obesity in this age were found. Mental health problems associated with obesity were not studied in depth.
Conclusions
The problem of overweight and obese children in early childhood has emerged only recently, over the past decade. This increased the burden of malnutrition and was associated with an increase in stunting and wasting in preschool children. The dietary patterns causing obesity could have also affected the increased stunting. The prominent finding was the increase in the MF beyond two years of age. Children who were EBF in the first six months, and not exposed to MF, showed significantly lower rates of overweight and obesity and negligible rates of stunting and wasting. Obesity was associated with increases in micronutrient deficiency states as iron and vitamin A and D and even B complex deficiency. Obesity seems to be influenced by the suboptimal early infant feeding practices and the superadded poor dietary practices of high fat, fast foods and sugary beverages, confounded by restricted outdoor activities and high milk intake in these years. It will take defiance of the giants ruling the world economy to arrest the commercialized feeding of MF and packed and unhealthy sweetened, salted or fried fast foods to children. Children living in poverty are victims to exploitation by markets that prosper at the expense of the health and survival of poor economies. Also improving our understanding of factors driving fat gain in young children should increase our ability to manage the rising problem of obesity.
Recommendations: The recommendations are consistent with those of the World Health Organization for controlling the aggressive marketing and commercialization of breast-milk substitutes, MF, GUM, baby foods and beverages for young children. Member states should implement policies to control advertisements and marketing tactics targeting the public especially mothers and family members in public areas, shopping outlets, on television and through digital marketing and cross border marketing [6,7]. The control measures should support messages that raise awareness of the public and the care takers in families and day care centers and schools to importance of healthy foods and dietary habits, and dangers of responding to marketing i.e. raise their media literacy, as well as encourage exercise, healthy life styles of activity, exercise, sleep and play. Also health and medical staff need to be advocates and become engaged starting by medical and nursing schools curricula, in their practice and by pressuring policies through advocacy campaigns. Encouraging awareness campaigns that counter the marketing messages and tactics used by industry, whilst encouraging foods, dietary habits and life styles that promote, support and invest in a paradigm shift to return to nature.
Disclosure: The authors alone are responsible for the views expressed in this article and they do not necessarily represent the views, decisions or policies of the World Health Organization or the other institutions with which the authors are affiliated.
Acknowledgements: We would like to thank the Sohag team headed by Dr Eman Sedik who assisted in extraction of the studies from Sohag medical library in Upper Egypt. We extend our appreciation to all the librarians and supervisors of the theses studies who supported us to complete this work.
References
- UNICEF/WHO/The World Bank Group joint child malnutrition estimates: levels and trends in child malnutrition: key findings of the 2021 edition. World Health Organization. Licence: CC BY.NC. SA 3.0 IGO. ISBN: 9789240025257. 5 May 2021.
- Koletzko B, Holzapfel C, Schneider U, Hauner H. Lifestyle and Body Weight Consequences of the COVID.19 Pandemic in Children: Increasing Disparity. Ann Nutr Metab. 2021; 77: 1.
- World Health Assembly, 54. Fifty fourth World Health Assembly, Geneva: summary records of committees and ministerial round tables: reports of committees. World Health Organization. 2001.
- Magrone T, Jirillo E. Childhood obesity: Immune response and nutritional approaches. Front Immunol. 2015; 6: 76.
- Lumeng CN, Deyoung SM, Bodzin JL, Saltiel AR. Increased inflammatory properties of adipose tissue macrophages recruited during diet. Induced obesity. Diabetes 2007; 56: 16–23.
- World Health Organization. Implementing the WHO recommendations on marketing of food and beverages to children in the Eastern Mediterranean Region. Regional Office for the Eastern Mediterranean p. 2018.
- World Health Organization. Guidance on ending the inappropriate promotion of foods for infants and young children: implementation manual. World Health Organization. License. 2017.
- Kraak VI, Vandevijvere S, Sacks G, Brinsden H, Hawkes C, Barquera S, et al. Progress achieved in restricting the marketing of high.fat, sugary and salty food and beverage products to children. Bull World Health Organ. 2016; 94: 540–548.
- Mannan H. Early infant feeding of formula or solid foods and risk of childhood overweight or obesity in a socioeconomically disadvantaged region of Australia: A longitudinal cohort analysis. Int J Environ Res Public Health. 2018; 15: 1685.
- CAPMAS and UNICEF, Child Poverty in Egypt. 2015.
- Ministry of Health and Population [Egypt], El.Zanaty and Associates [Egypt], and ICF International. Egypt Demographic and Health Survey 2014. Cairo, Egypt and Rockville, Maryland, USA: Ministry of Health and Population and ICF International. 2015.
- UNICEF. Children in Egypt: A statistical digest, UNICEF Egypt, Cairo, Egypt. 2015.
- Vanhees K, Vonhögen IG, van Schooten FJ, Godschalk RW. You are what you eat, and so are your children: the impact of micronutrients on the epigenetic programming of offspring. Cell Mol Life Sci. 2014; 71: 271–285.
- WHO Multicentre Growth Reference Study Group. WHO Child Growth Standards: length/height.for.age, weight.for.age, weight.for.length, weight.for.height and body mass index.for. age: methods and development. Geneva: World Health Organization. 2006.
- Ghalli I, Salah N, Hussien F, Erfan M, El.Ruby M, Mazen I, et al. In: Sartorio A, Buckler JMH, Marazzi N, editors. Egyptian growth curves 2002 for infants, children and adolescents. Crescerenel mondo, Ferring Publisher. 2008.
- Megahed AAA. Overweight `and obesity among preschool children attending a family health unit in Tala district, Menoufia governorate. Theses, Master in Family Medicine. Supervised by DL Ellahony, NA Khalil. Faculty of Medicine, Menoufia University. 2020.
- Rantisi AAA. The Nutritional status of infants and children attending the outpatient clinic of Alexandria University Children’s Hospital. Theses, Master in pediatrics. Supervised by M Badr ElDin, G Arif, A. Abdel Al. Faculty of Medicine, Alexandria University. 1976.
- Jelliffe DB. The Assessment of the Nutritional Status of the Community. WHO Monograph Series No. 56, WHO, Geneva (1966).
- Farahat GM. Assessment of the nutritional status of young children attending the Alexandria University Children’s Hospital using anthropometric parameters. Theses, Master in Pediatrics. Supervised by MA Abdel Moneim, B El. Domiaty. Faculty of Medicine, Alexandria University. 1983.
- de Onis M, Garza C, Onyango AW, Borghi E. Comparison of the WHO child growth standards and the CDC 2000 growth charts. J Nutr. 2007; 137: 144–148.
- ElAbd AME. Assessment of food consumption patterns and nutritional status of preschool children in light of the emerging nutrition transition. Theses, Master in Public Health (Nutrition). Supervised by N ElSayed, M Hassan. High Institute of Public Health, Alexandria University. 2000.
- Metwally HA. Determinants of nutritional status of preschool children in rural areas in Gharbia. Theses, Master Degree Public Health Nutrition. Supervised by F Elsahn, L Nofal. High Institute of Public Health, University of Alexandria. 2017.
- Mohamed, Hend H. Assessment of nutritional status among Egyptian preschool children. Theses, Master degree in Pediatrics. Supervised by S. Yousef, S. Elmasry, N. Younis. Faculty of Medicine, Ain Shams University. 2008.
- Hastings G, Stead M, McDermott L, Forsyth A, MacKintosh A, et al. Review of research on the effects of food promotion to children. Final report, prepared for the Food Standards Agency. Glasgow: University of Strathclyde. 2003.
- UNICEF: www.unicef.org. Monitoring the situation of Children and Women: http://data.unicef.org/
- Botlans E, Thrivel D, Mazur A, et al. Digital Food Marketing to Young People: A Substantial Public Health Challenge. Ann Nutr Metab. 2020; 76: 6–9.
- Mohamed, Zeeina MA. Correlation between body mass index and severe early childhood caries in a group of preschool children in Ismailia city. Theses, Master degree in Pediatric Dentistry. Faculty of Dentistry, Suez Canal University. 2012.
- Mostafa, Soad MA. Evaluation of the Nutritional status for pre. school children in Sharkia governorate. Theses, Master in Agricultural Food Science (Rural Home Economic) Supervised by Sohir ElSayed ElSaiedy. Faculty of Agriculture, Zagazig University. 2018.
- Khalaf Allah, Ola SA. Assessment of nutritional status for preschool children (from 3.6 years). Theses, Master degree in Community Medicine. Faculty of Medicine, Menoufia University. 2014.
- Abd. ElGawad, Doaa AS. Problem of obesity and the predisposing factors among preschool children at Mansoura City. Theses, Master degree in Community Health Nursing. Faculty of Nursing, Zagazig University. 2014.
- AbdElSalam Azza RA. The nutritional status of preschool children at Bani.Bakr Family Health Unit in Kafr. ElSheikh Governorate. Theses, Master in Family Medicine. Supervised by BH Dawood, FM ElGamal, SKS Khashab. Faculty of Medicine, Alexandria University. 2016.
- Emtair, AAM. The nutritional status of preschool children at Sidi. Beshr Bahary Family Health unit in Alexandria Governorate. Theses, Master in Family Medicine. Supervised by FM ElGamal, BH Dawood, SKS Khashab. Faculty of Medicine, Alexandria University. 2016.
- Amusha AAK. The nutritional status of preschool children at Al.Amrawy Family Health Center in Alexandria Governorate. Theses, Master in Family Medicine. Faculty of Medicine, Alexandria University. 2016.
- Rakha SME. Assessment of overweight and obesity among preschool children in day care centers in Alexandria. Theses, Master Degree of Community Health Nursing. Supervised by FEE Fikry, AAM Ali and AMM Ali. Faculty of Nursing, University of Alexandria. 2019.
- Pereira C, Ford R, Feeley AB, Sweet L, Badham J, Zehner E. Cross. sectional survey shows that follow. up formula and growing. up milks are labelled similarly to infant formula in four low and middle income countries. Matern. Child Nutr. 2016; 12: 91–105.
- Abdel Allah, Hend NA. Determinants of Stunting Growth of Children in Rural Areas in Qalyoubia Government. Theses, Master in Family medicine. Faculty of Medicine, Menoufia University. 2017.
- Fatemeh T, Mohammad. Mehdi HT, Toba K, et al. Prevalence of overweight and obesity in preschool children (2–5 year.olds) in Birjand, Iran. BMC Res Notes. 2012; 5; 529.
- Hammoda, ABF. The Double Burden of Stunting and Excess Body Weight Among Preschool Children in Itay Albarud City, Elbeheira Governorate Theses, Master in Public Health, community medicine, Faculty of Medicine, Tanta University. 2021.
- Ebrahim S, Kinra S, Bowen L, Andersen E, Ben. Shlomo Y, et al. Indian Migration Study group. The effect of rural.to.urban migration on obesity and diabetes in India: a cross.sectional study. PLoS Med. 2010; 7: e1000268.
- Barakat, TEI. Evaluation of body mass index among preschool children with bronchial asthma in Ismailia general hospital at Ismailia Government. Theses, Master degree in Pediatrics. Supervised by M. Kalioby, N Mosad, A Kamel. Faculty of Medicine, Suez Canal University. 2013.
- Abo. Hatab AAM. Factors associated with undernutrition among primary health care settings in Alexandria. Theses, Master Degree of Community Health Nursing. Supervised by HH Metwally, HH El.Sherbini. Faculty of Nursing, University of Alexandria. 2017.
- El. Sheekh HAM. An evaluation of the Global WHO child growth standards of under.five in Gharbia Governorate. Theses, Master Degree in Pediatrics. Supervised by AM Abul. Fadl, GM Anwar, DR Soliman. Faculty of Medicine, Benha University. 2011.
- Darwish A. An evaluation of the Global WHO child growth standards of under.five in Menoufia Governorate. Theses, Master Degree in Pediatrics. Supervised by AM Abul. Fadl, GM Anwar, DE Soliman. Faculty of Medicine, Benha University. 2011.
- Mohamed ES. Prevalence and risk factors of childhood obesity in Sohag City. Thesis, Master in Pediatrics. Supervised by S.E.A. Hadhood and M.M. Mohamed, Faculty of Medicine, Sohag University. 2018.
- Mahfoz, Sohad TA. Risk factors of obesity in preschool children in Port Fouad. Theses in Pediatrics. Supervised by M. El.Kalioby, SS Gad, LA Fiala. Faculty of medicine, Suez Canal University. 2016.
- Khalifa MA. Risk factors of obesity among preschool children in nursery schools in Port Said. Theses, Master degree in Pediatrics. Supervised by M. Kalioby, A. Abdel Halim. Faculty of Medicine, Suez Canal University. 2012.
- Elsayed, Marwa M. Assessment of risk factors of obesity among preschool children in Suez City. Theses, Master degree in Pediatrics. Supervised by M. Kalioby, A. Abdel Halim. Faculty of Medicine, Suez Canal University. 2012.
- World health Organization. International Code of Marketing Breast.milk Substitutes, WHO, Geneva, Switzerland. 1981.
- Shaaban EMA. The relationship between feeding patterns and nutritional status of preschool children attending primary care centres in Alexandria. Theses, Doctor Degree of f Pediatric Nursing. Supervised by FA Aly, mO Darwish, MM Youssef. High Institute of Nursing, University of Alexandria. 1990.
- Al.Jawaldeh A and Abul. Fadl A. Assessment of Baby. friendly Hospitals in the Eastern Mediterranean region. Children. 2018.
- Huang J, Zhang Z, Wu Y, Wang Y, Wang J, et al. Early feeding of larger volumes of formula milk is associated with greater body weight or overweight in later infancy. Nutrition Journal. 2018; 17: 12.
- Dyab NA. Assessment of preschool children health status in Alexandria squatter areas. Theses, Master Degree of Pediatric Nursing. Supervised by HH Metwally, MA Abdel Wahed, YY Sabry. Faculty of Nursing, University of Alexandria. 2009.
- ElGhonemy, GEA. Study of obesity among preschool children: prevalence, risk factors and health status. Theses, Doctorate in Public Health (Maternal and Child Health). Supervised by E. Eid, E. Saleh, MH. Mohammed. High Institute of Public Health, Alexandria University. 2003.
- El.Sherbiny Amani MHE. Assessment of growth & development of preschool children in Gamasa – Dakahlia, Egypt. Theses, Master in Forensic medicine. supervised by F. Hanafi, A. Elhawary and G. ElKhawag. Faculty of Medicine, Mansoura University, 2018.
- Hassan RAA. Health status assessment of preschool children in Sohag city. Theses, Master Degree of Community Health Nursing. Supervised by MA Queda, YY Sabry, IK Kassem. Faculty of Nursing, University of Alexandria. 2015.
- Ismail, Samah AI. Prevalence of obesity in preschool children in Elkantara East City. Theses, Master degree in Pediatrics. Faculty of Medicine, Suez Canal University, 2014.
- Seliman, Hanan M. Determinants of nutritional status of preschool children in a rural areas in Gharbia governorate. Theses, Master in Public Health. Supervised by H. ElSadek, F. Sahn, L. Nofal. High Institute of Public Health, Alexandria University. 2002.
- Harraz MMH. The relation between knowledge, attitude and practices of mothers about initiation and exclusiveness of Breastfeeding and infant nutritional status in Idku, Beheira. Theses, Master in Family Medicine. Faculty of Medicine, Alexandria University. 2020.
- Abdelgawad DAS. Effect of educational program on mother’s knowledge and their nutritional habits about obesity among their preschool children, Theses, Master Degree of Pediatric Nursing. Supervised by FE Abu Saad and AK Elhawary. Faculty of Nursing, University of Alexandria. 2017.