
Journal of Clinical Images and Medical Case Reports
ISSN 2766-7820
Case Report - Open Access, Volume 2
OSA: Special suspected in spontaneous cerebrospinal fluid leakage
Fabrizia Elli1*; Elena Bernardini1; Paolo Battaglia1,2; Paolo Castelnuovo1,2
1 Division of Otorhinolaryngology, Department of Biotechnology and Life Sciences, University of Insubria-Varese, ASST Sette Laghi, Ospedale di Circolo, Varese, Italy.
2 Head and Neck Surgery & Forensic Dissection Research Center, Department of Biotechnology and Life Sciences, University of Insubria, Varese, Italy.
*Corresponding Author: Fabrizia Elli
Division of Otorhinolaryngology, Department of
Biotechnology and Life Sciences, University of
Insubria, Ospedale di Circolo e Fondazione Macchi,
Via Guicciardini 9, 21100, Varese, Italy.
Email: fabrizia.elli@hotmail.it
Received : Aug 06, 2021
Accepted : Sep 09, 2021
Published : Sep 16, 2021
Archived : www.jcimcr.org
Copyright : © Elli F (2021).
Abstract
Objectives: Loss of Cerebrospinal Fluid (CSF-L) results from a rupture of the skull base and overlying meninges, and pathological communication between the subarachnoid space and the nasal or middle ear cavity. Recently, the pathogenesis has been linked with Intracranial Hypertension (IIH), elevated Body Mass Index (BMI) and Obstructive Sleep Apnea (OSA).
Methods: A single institution retrospective study was conducted on 14 patients from our spontaneous CSFL series, which included 167 patients over a 15-year period from 2004 to 2019. All patients underwent to home respiratory polygraphy. Epidemiological and clinical data were reviewed. For the statistical analysis, the confidence interval for a proportion was defined, according to the methods described by RG Newcombe.
Results: 14 patients, previously operated on duraplasty in our ENT department, were enrolled. They underwent to polygraphy. The data were compared with those derived from the literature and the results are neither in the range of the general population nor in the non-spontaneous CSFL
Conclusion: OSA can increase Intracranial Pressure (ICP) and thus spontaneous CSF losses. However, OSA and BMI may not be independent. Therefore, further studies are needed to analyze the data in detail.
Citation: Elli F, Bernardini E, Battaglia P, Castelnuovo P. OSA: Special suspected in spontaneous cerebrospinal fluid leakage. J Clin Images Med Case Rep. 2021; 2(5): 1313.
Introduction
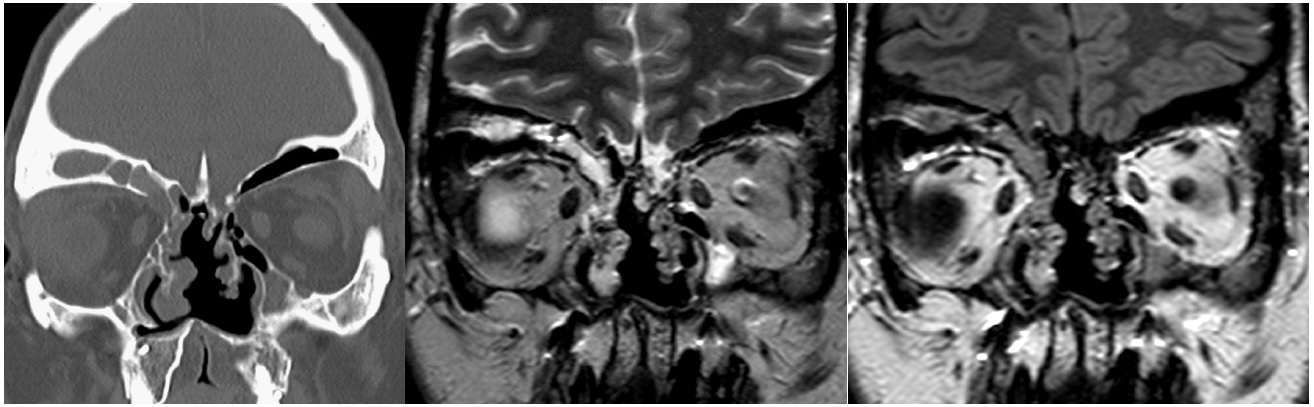
Cerebrospinal Fluid Leakage (CSF-L), presenting with watery rhinorrhea or otorrhea, results from a disruption in the skull base and in the overlying meninges, leading to a pathological communication between the subarachnoid space and the nasal or middle ear cavity (Figure 1). The meninges and the brain parenchyma can also herniate through the bony defects, causing meningocele and encephalocele. Spontaneous CSF-L occur in the absence of a known etiologic factor, such as trauma, iatrogenic injury, infection or tumor [1].
Although the etiology of spontaneous CSF-L is still unclarified, evidence supports a key role of chronically elevated Intracranial Pressure (ICP) in their development and progression.
Persistently elevated CSF pressure over time determines dehiscence in the weaker sites of the skull base, such as the cribriform plate or an overly pneumatized lateral sphenoid recess; in addition, the pulsatile force causes the formation of arachnoid pits, with progressive bone erosion [2,3].
Spontaneous CSF-L patients, compared to the non-spontaneous counterpart, are more commonly women (84.3% vs 41.1%), have a higher BMI (35.6 vs 30.0), are older (51.7 vs 42.0 years), and are more likely to have a diagnosis of obstructive sleep apnea (OSA) (30.0% versus 14.3%). They often report symptoms of elevated ICP, including pressure-type headaches, vertigo, pulsatile tinnitus or visual disturbances. MRI evidence of empty sella, one of the most sensitive and specific radiological features of chronic endocranic hypertension, is found in 55.4% of spontaneous and in 24.3% of non-spontaneous CSF-L cases [2].
Three are the main suspected to the development of pathology:
- Idiopathic intracranial hypertension: basing on the epidemiologic, clinical and radiologic evidence, the development of a spontaneous CSF-L has been considered a manifestation of Idiopathic Intracranial Hypertension (IIH), a syndrome characterized by an elevation in CSF pressure with normal brain parenchyma, in the absence of hydrocephalus or of an identifiable causative factor [3].
Over 80% of patients presenting IIH are women of childbearing age. Ninety percent are obese. Although the overall incidence of IIH is estimated 0.9 per 100,000, this rate increases 20-fold to 19 per 100,000 when only considering overweight women. IIH incidence may be increasing proportionately to the obesity epidemic occurring domestically and globally. Nonobese patients, males, older adults and children can also be diagnosed, but may present different symptoms and have worse outcomes [4].
Obesity, age, and female gender are strong predisposing factors for both IIH and CSF-L. Obstructive sleep apnea is a feature associated with both obesity and age, but, conversely, it is more common in males [5].
Elevated BMI and associated centripetal fat accumulation, results in elevated intra-abdominal and intra-pleural pressures. These high visceral pressures cause cardiac filling-pressures to rise, causing a systemic increase in venous pressure and decreasing venous return from the brain. It is theorized that systemic venous pressure increases and has an effect on ICP in two independent ways. First, the dilation of veins in the brain causes a mass-like effect and increases intracranial pressures; and second, it prevents CSF circulation by blocking drainage of CSF from arachnoid villi into the dural sinuses [6]. Over time, pulsatile forces at arachnoid villi cause formation of arachnoid pits and erosion of the skull base. Once the CSF pressure in the brain exceeds the tensile strength of inherently weak sites within the skull base, such as the cribriform plate and pneumatized lateral sphenoid recesses, leaks follow. Furthermore, large-scale clinical studies assessing lumbar puncture opening pressures have confirmed that CSF pressure increases with every unit increase in BMI [7].
In a mechanism independent to that of elevated BMI, OSA has also been associated with elevated ICP. OSA is characterized by spells of apnea leading to episodic nocturnal hypoxia and hypercapnia. Jennum and Borgensen discovered that during sleep, patients with OSA developed significant ICP elevations that were synchronously associated with their episodes of apnea [6]. They noted that during episodes of apnea, three phases of ICP elevation could be distinguished: An initial increase in ICP associated with the onset of apnea, followed by a slow increase mediated by hypercapnia, hypoxia, and cerebral vasodilation; and finally, a steep increase in ICP mediated by increased systemic arterial and central venous pressures. Furthermore, they found that even during awake states, the values of ICP were pathologically elevated in patients with severe OSA [2]. The association between OSAS and CSF-L may, therefore, be confounded by the fact that obesity and other predisposing factors tend to coexist in the same subpopulation, and that they may be different clinical aspects of the same underlying pathology. However, recent evidence suggests an independent role of some of these factors in the development of spontaneous CSF-L.
- BMI: there is a positive linear correlation between BMI and CSF pressure, with an increase of 0.24 mmHg in CSF pressure for every unit of BMI [7].
Under physiological conditions CSF is produced at a rate of 0.3 mL/min and absorbed at the arachnoid villi granulations into the sagittal sinus. The absorption process is driven by a hydrostatic pressure gradient between CSF and the dural venous sinuses. Central obesity increases intra-abdominal visceral pressure and decreases the venous return from the brain; this determines an elevated cerebral venous pressure, which prevents CSF outflow, resulting in elevated ICP.
In the past 30 years, obesity has had a dramatic raise in the USA, reaching a national rate of 30%. An American national multicentric study involving 81 centers has highlighted that, in the period 2002- 2012, the rate of craniotomies spontaneous CSFL repair has more than doubled (a 124% increase, from 218 cases per year to 448 cases per year), with a trend towards more spontaneous CSF leaks in regions with higher obesity rates. Based on these estimates, an obese person has a 1: 17.000 chance in ten years of requiring a craniotomy for a spontaneous CSF-L. Conversely, the rate of craniotomies for non-spontaneous CSF-L repair has not increased significantly in the same period (from 197 to 209 cases per year) [9].
In the experience of a local institution these data are confirmed: A 66% increase in the rate of craniotomies for spontaneous CSF-L has been observed in period 2010-2012 compared to the period 2002-2004, with no change in the number of craniotomies for non-spontaneous CSF-L, resulting in an increase of spontaneous CSF-L from 37.5% to 50%. In this cohort, 72.1% of the patients with spontaneous CSF-L were female. The mean age was 57.03 years. All of them (100%) were overweight (BMI > 25 kg/m2) and 83.6% of them were obese (BMI > 30 kg/m2), with an average BMI of 37,9 kg/m2.
OSA: According to another study comparing patients with spontaneous to non-spontaneous CSF otorrhea, in the first group patients had a higher BMI (35.2 vs 28.5) and were more likely to have a diagnosis of OSA (29% vs 7%) and arterial hypertension (64% vs 20%) [10]
Although the heterogeneity in BMI might explain the different prevalence, OSA may be an additional independent risk factor for the development of spontaneous CSF-L. In addition to the persistently elevated ICP caused by IIH and obesity, obstructive sleep apneas are believed to cause episodic increase in ICP. Episodes of hypoxia and hypercapnia can alter the cerebrovascular hemodynamics and lead to cerebral vasodilation, increasing cerebral venous pressure and impairing CSF drainage [6].
Multiple ICP elevations during sleep may lead to an overall increase in ICP during the day, although in some patients the basal ICP is normal. However, we have to consider that the literature on the association between OSA and spontaneous CSFL is limited to retrospective studies.
It should be mentioned that around 26,7% of the general population have an AHI ≥5 events per hour (26,2% in men and 28% in women) [11]. They have defined abnormal breathing as a complete cessation of airflow for ≥ 10s (apnea) or a discernible 50% reduction in respiratory airflow accompanied by a decrease of 4% in oxyhemoglobin saturation and/or an electroencephalographic arousal.
The calvarium was found to be 23 % thinner in patients with spontaneous CSFL than in control groups and no differences between obese and non-obese patients were evident. This suggests that other factors independent of obesity have a primary pathogenetic role. However, Nelson and co-workers were not able to demonstrate a correspondence with OSA, because its incidence was similar in the two groups. This study did not evaluate ICP values, so the ability of thicker skulls to sustain higher CSF pressures might have been a confounding factor [12].
- CPAP: There are no evidence suggesting that treating OSA reduces ICP. However, observational studies have reported that nocturnal oxygenation improves the signs and symptoms of idiopathic intracranial hypertension in men [13].
The association between nCPAP treatment and CSFL in the absence of skull base trauma has been reported only in rare cases in literature [14,15].
In two case-reports, CSF-L occurred in middle-aged women with no previous history of head trauma, sino-nasal surgery or rhinosinusitis, diagnosed with moderate and severe OSA, after treatment with nCPAP at 10 cmH2 O for 3 years and at 18 cmH2 O for 11 months respectively. The radiological investigations showed in the first case an extensive pneumatization of the sinuses with a CSF leak into the left sphenoidal sinus; in the second case a bone thinning with intraoperative evidence of a right sphenoidal meningocele [14,15].
Kuzniar (2005) reports a case of a 63-year-old woman, who underwent endoscopic sinus surgery for CRSwNP 10 years before, with moderate OSAS of recent diagnosis. Within 2 weeks following the introduction of nCPAP at 12 cmH2 O she presented with copious clear rhinorrhea due to a CSF-L in the lateral lamella of the cribriform plate [14].
Another case report described the appearance of spontaneous CSF rhinorrhea after increasing the pressure of CPAP treatment from 5 to 7cmH2 O [16].
Moreover, a study on healthy volunteers has shown that the administration of CPAP at high pressure levels can increases central venous pressure and ICP [17].
The pathophysiological effect of CPAP treatment on ICP is complex: on one hand the reduction in sleep apnea episodes has a beneficial effect on apnea related ICP alterations. On the other hand, positive pressure ventilation may lead to a rise in ICP by decreasing venous return and therefore increases central venous and longitudinal vertebral venous pressures. In addition, CPAP therapy can exacerbate pre-existing subclinical defects or communications between the subarachnoid space and aerated spaces which are exposed to positive pressure.
In all the reported cases, the patients presented some additional risk factors for the development of CSFL other than CPAP therapy: all were women, one of them was obese; they had anatomical variants.
Despite clear rhinorrhea is a non-specific and common symptom in nCPAP users, it is important to take into consideration that it might be the presenting symptom of a CSFL.
Materials and methods
A single institution retrospective study was conducted on 14 patients from our spontaneous CSFL series, which included 167 patients over a 15-year period (2004-2019). Home sleep respiratory polygraphy recordings were made using portable Embletta MPR (Embla) and Nox T3 (Nox Medical) devices with sensors for nasal pressure and thoracic and abdominal effort, and oximetry (signal averaging time <1 second) measured by finger probe.
Patients were educated on the use of night recording devices. Each exam was manually assessed using specific software: Remlogic-e (Embla) and Nocturnal (Nox Medical).
Recordings were considered valid when they included more than four hours of good quality signal. Apneas were described as a >90% airflow reduction and hypopneas as a >30% airflow reduction associated with ≥3% oxygen desaturation for at least 10 seconds.
AHI was defined as the number of respiratory events (apneas + hypopneas) per hour. According to final scoring AHI values were classified either as normal (AHI < 5/h), mild (AHI between 5 and 14.9 events per hour), moderate (AHI between 15 and 29.9/hour), or severe (AHI > 30/hour).
For the statistical analysis, the confidence interval for a proportion was defined, according to two methods described by R.G. Newcombe, both derived from a procedure outlined by E. B. Wilson in 1927. The proportion of our series was tested with Fisher's exact probability test or Chi-squared test (χ2 ) depending on the sample size.
Results and discussion
14 patients, previously operated for duraplasty in our ENT department, were enrolled. They have been asked to undergo polygraphy as described in materials and methods. The results of the exams are summarized in Table 1 together with age, sex and BMI.
Table 1: Specific data for each patient enrolled in the study, subdivided into physical characteristics and results related to polygraphy.
Patients |
Sex |
Age |
AHI tot |
AHI supine |
AHI non supine |
ODI |
CT90 |
Nadir |
BMI |
1 |
F |
1968 |
6,8 |
10,6 |
3,7 |
8 |
0,2 |
84 |
26,7 |
2 |
F |
1946 |
59,8 |
79,1 |
56,7 |
50,6 |
7,6 |
71 |
30 |
3 |
M |
1954 |
12,4 |
45 |
4,8 |
11,9 |
2,2 |
84 |
30,2 |
4 |
F |
1970 |
14,7 |
18,7 |
5,8 |
10,8 |
11,4 |
81 |
37,2 |
5 |
F |
1953 |
26,9 |
26,9 |
24,9 |
26,3 |
34,3 |
78 |
28,5 |
6 |
M |
1965 |
6,5 |
11,5 |
1,5 |
10,2 |
0,9 |
87 |
24,3 |
7 |
F |
1965 |
5,4 |
13,8 |
4,2 |
6,4 |
1,6 |
84 |
26,5 |
8 |
F |
1952 |
14,4 |
23,4 |
5,1 |
15,1 |
1,7 |
77 |
29 |
9 |
F |
1951 |
31,4 |
46 |
5,7 |
27,3 |
1,7 |
79 |
35 |
10 |
M |
1974 |
18,4 |
34,5 |
5,9 |
13,9 |
0,2 |
89 |
27,5 |
11 |
F |
1955 |
3,1 |
4,6 |
1,9 |
3,4 |
0 |
91 |
24 |
12 |
F |
1962 |
6 |
8 |
4,1 |
5,7 |
0 |
85 |
19,4 |
13 |
F |
1960 |
1,4 |
3,3 |
0 |
2 |
0 |
91 |
40,9 |
14 |
F |
1962 |
22,6 |
77,2 |
11,2 |
22,9 |
1,6 |
83 |
32,5 |
The data obtained (Table 2) were compared with those derived from the available literature. Attention was focused on the “AHI≥10” column of the table which shows the proportions of patients suffering of OSA with an AHI higher than 10.
The data comes from the papers of Fleischman et al and Duran et al.
Fleischman et al compared patients with spontaneous CSFL to non-spontaneous CSFL acting as a control group. Since, nonspontaneous CSFL derives from traumatic or iatrogenic events, it cannot be assimilated to the general population.
Therefore, data representing the general population were extrapolated from the Duran et al. Paper. The analysis began with the calculation of the confidence intervals of the proportions of the “AHI≥10” column.
The lower and upper limits of the 95% confidence interval for a proportion were, according to two methods described by R.G. Newcombe, both derived from a procedure outlined by E. B. Wilson in 1927 [18].
Table 2: Comparison between data of present study and general population (corresponding patients of the work of Fleischman and Duran).
AHI ³ 5 |
AHI ³10 |
AHI ³15 |
BMI |
|
||||||
SPONTENEOUS Group A |
21/70 |
0,3 (0,1993- 0,4229) |
35,64 |
Fleischman, et al. 2014 |
|
|||||
NON-SPONTANEOUS Group B |
ago-56 |
0,1429 (0,069- 0,2678) |
29,99 |
Fleischman, et al. 2014 |
||||||
SPONTANEOUS Group C |
13/14 |
92,90% |
ago-14 |
0,5714 (0,2965-0,8118) |
mag-14 |
35,70% |
29,34 |
± 5,6 S.D. |
Present study |
|
GENERAL POPULATION Group D |
582/2148 |
27,10% |
357/2148 |
0,1657 (0,1504-0,1823) |
226/2148 |
10,5 |
25,6 |
± 3,7 S.D. |
Duran, et al. 2001 |
|
The results (i.e., the proportion with the lower and upper limits of the confidence interval) are reported in table 2 and plotted in Figure 2.
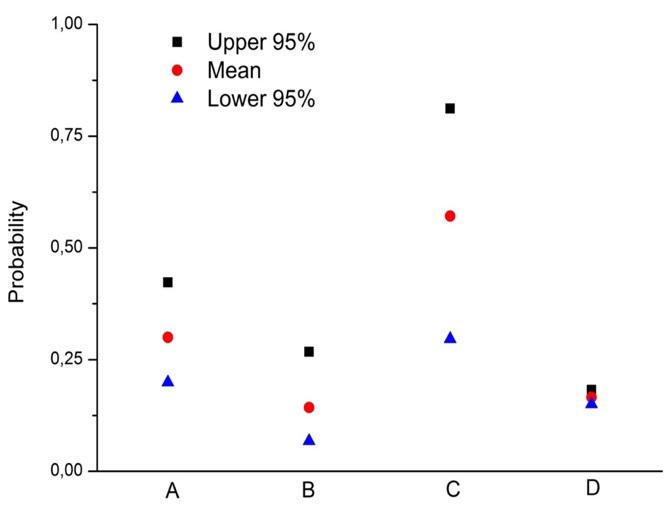
Looking at the plotted data, the results of the present study are not comprised in the general population interval nor in the non-spontaneous CSFL. Any differences between our proportion were then tested using the Fisher exact probability test or Chi-Square test (χ2 ) depending on the sample size.
Our data were compared (row C of table 2) to those of the general population (row D of table 2). Since the confidence limits do not overlaps (Figure 2) the test had to prove the difference. However, since the sample size of the two tested groups are extremely different, both tests used (i.e. Fisher exact probability test and Chi-Square test) did not serve the purpose. Further statistical analysis would be necessary to perform the test. Alternatively and more wisely, the C group should be enriched.
Therefore, comparing patients of our series (group C) with the corresponding patients of the work of Fleischman et al (group A) the probability resulted higher than 0,05 (p>0,05) indicating that the two groups are not different.
Then, testing our patients versus the control group of the work of Fleischman et al, group B, the comparison, that was performed with the Fisher exact probability test, gave a result of p=0,0019 indicating that the two groups are different.
The groups of Fleischman et al (group A and B) were compared with general population of Duran et al (group D). These tests were performed with Chi-Square test (χ2 ) since the sample size of group D was too large for the Fisher exact probability test. As expected, group A resulted statistically different from the general population with a p value of 0,0056. Group B, which represented the control group for the work of Fleischman et al, instead, did not result different from the general population (p=0,7772). In this contest, at the moment, BMI results were not considered.
To seriously take it in consideration would require a complex statistical analysis since the two variables (i.e., AHI and BMI) might be not independent and therefore BMI could represent a confounding problem.
Moreover, the population that was taken into consideration by Fleischman et al (as for as it concerns BMI) is quite different from the European populations considered in the present work and in that of Duran.
Conclusion
OSA may contribute to elevate ICP and consequently the spontaneous CSF leaks, but OSA and BMI might be not independent and therefore BMI represent a confounding problem. Therefore, it is necessary to increase our cohort to proceed with a more detailed analysis of the data.
Authors' contributions: All authors contributed to data analysis and manuscript writing. All authors have reviewed and approved the final version of the manuscript.
The study has been conducted with policies approved by the local IRB (Insubria Board of Ethics), which waived the need for patient consent in this retrospective analysis.
References
- Wang EW, Vandergrift WA 3rd, Schlosser RJ. Spontaneous CSF Leaks. Otolaryngologic clinics of North America. 2011; 44:845– 856.
- Fleischman GM, Ambrose EC, Rawal RB, Huang BY, Ebert JrCS, et al. Obstructive Sleep Apnea in Patients Undergoing Endoscopic Surgical Repair of Cerebrospinal Fluid Rhinorrhea, Laryngoscope. 2014; 124: 2645–2650.
- Schlosser RJ, Wilensky EM, Grady MS, Bolger WE. Elevated intracranial pressures in spontaneous cerebrospinal fluid leaks. American journal of rhinology. 2003; 17: 191–195.
- Wall M. Idiopathic intracranial hypertension (pseudotumor cerebri). Curr Neurol Neurosci Rep. 2008; 8: 87–93.
- Lee W, Nagubadi S, Kryger MH, Mokhlesi B. Epidemiology of obstructive sleep apnea: A population-based perspective. Expert Rev Respir Med. 2008; 2: 349-364.
- Jennum P, Borgesen SE. Intracranial pressure and obstructive sleep apnea. Chest. 1989; 95: 279– 283.
- Berdahl JP, Fleischman D, Zaydlarova J, Stinnett S, Allingham RR, Fautsch MP. Body mass index has a linear relationship with cerebrospinal fluid pressure. Investigative ophthalmology & visual science. 2012; 53: 1422–1427.
- Bakhsheshian J, et al. Association Between Obstructive Sleep Apnea and Spontaneous Cerebrospinal Fluid Leaks. A Systematic Review and Meta-analysis. 2015.
- Nelson,The Rising Incidence of Spontaneous Cerebrospinal Fluid Leaks in the United States and the Association with Obesity and Obstructive Sleep Apnea- Otology & Neurotology. 2014; 36: 476Y480 Ó.
- LeVay AJ, Kveton JF. Relationship between obesity, obstructive sleep apnea, and spontaneous cerebrospinal fluid otorrhea. Laryngoscope. 2008; 118: 275-278.
- Durán J, Esnaola S, Rubio R, Iztueta A. Obstructive sleep apneahypopnea and related clinical features in a population-based sample of subjects aged 30 to 70 yr. Am J Respir Crit Care Med. 2001; 163: 685-9.
- Nelson RF, Hansen KR, Gantz BJ, Hansen MR. Calvarium thinningin patients with spontaneous cerebrospinal fluid leak. Otol Neurotol. 2015; 36: 481-485.
- Lee AG, Golnik K, Kardon R, Wall M, Eggenberger E, Yedavally S. Sleep apnea and intracranial hypertension in men. Ophthalmology. 2002; 109: 482-485.
- Kuzniar TJ, Gruber B, Mutlu GM. Cerebrospinal fluid leak and meningitis associated with nasal continuous positive airway pressure therapy. Chest. 2005; 128: 1882–4.
- Yared J, El Annan J. Cerebrospinal fluid leak associated with nasal continuous positive airway pressure treatment for obstructive sleep apnoea. BMJ Case Rep. 2010; 2010.
- Bernstein AL, Cassidy J, Duchynski R, Eisenberg SS. Atypical headache after prolonged treatment with nasal continuous positive airway pressure. Headache. 2005; 45: 609-11.
- Hörmann C, Mohsenipour I, Gottardis M, Benzer A. Response of cerebrospinal fluid pressure to continuous positive airway pressure in volunteers. Anesth Analg. 1994; 78: 54-7.
- Newcombe RG. Two-sided confidence intervals for the single proportion: Comparison of seven methods. Statistics in Medicine, 17, 857-872 (1998). – Wilson E.B. Probable inference, the low of succession and statistical inference. Jornal of the American Statistical Association. 22, 209-212.