
Journal of Clinical Images and Medical Case Reports
ISSN 2766-7820
Case Report - Open Access, Volume 2
Diversity in the intestinal microbiota and the influence of delivery, dietary profile and nutritional status
Franciele Valduga1*; Malena Rostirola Miri; Daniela Signori2; Larissa Pereira da Costa3; Andreza Francisco Martins4; Caroline Dani5
1 Nutritionist, MSc, Biosciences and Rehabilitation, Methodist University Centre – IPA.
2 Biomedical Scientist, Institute of Basic Health Sciences, Federal University of Rio Grande do Sul, Porto Alegre, Brazil.
3 Pharmacist, Institute of Basic Health Sciences, Federal University of Rio Grande do Sul, Porto Alegre,Brazil.
4 Pharmacist, Professor, Institute of Basic Health Sciences, Federal University of Rio Grande do Sul, Porto Alegre,Brazil.
5 Biomedical Scientist, Professor,Program in Biosciences and Rehabilitation at Methodist University Centre - IPA.
*Corresponding Author: Franciele Valduga
Nutritionist, MSc, Biosciences and Rehabilitation,
Methodist University Centre – IPA,60 José Manfredini
Street. Bento Gonçalves, Rio Grande do Sul, Brazil.
Email: franciele.valduga@gmail.com
Received : Aug 09, 2021
Accepted : Sep 20, 2021
Published : Sep 24, 2021
Archived : www.jcimcr.org
Copyright : © Kumarihamy P (2021).
Abstract
Objective: This research aimed to evaluate the nutritional status and influence on the dietary profile in the gut microbiota, in an attempt to identify possible effects of grape juice consumption among school children aged 6-10.
Design: Anthropometric parameters (weight, height, Body Mass Index, waist circumference, triceps, and subscapular skinfold) weremeasured at baseline. A Food Frequency Questionnaire (FFQ) was carried out to evaluate the dietary profile. Feces were analyzed by culture methods and the alpha diversity was determined by the Shannon Index.
Participants: 36 volunteer school children aged 6 to 10 years from two different cities in the South of Brazil.
Main outcome measure: Gut microbiota diversity according to anthropometric parameters, nutrition profile and delivery patterns.
Analysis: For statistical analysis, t or u test and correlation were used through the statistical software SPSS® version 22.0.
Results: The volunteers presented a eutrophic nutritional status, but 41.7% in the City 2 were overweight. There was a significant difference in the consumption of polyphenols (p<0.003), microbiotadiversity, breastfeeding, and delivery patterns by city. However, the dietary profile does not include the portions of daily nutrients recommended in both cities. The volunteers from City 1 presented a greater alpha diversity, which may be related to higher micronutrient intake, breastfeeding, and predominant natural/vaginal delivery
Conclusion: We observed that the normal delivery and the dietary profile seems to be important factors to the gut microbiota diversity in these children.
Keywords: grape juice; dietary profile; gut microbiota.
Citation: Valduga F, Miri MR, Signori D, Costa LPD, Martins AF. Diversity in the intestinal microbiota and the influence of delivery, dietary profile and nutritional status. J Clin Images Med Case Rep. 2021; 2(5): 1325.
Introduction
The intestine is the largest immune organ in the human body with approximately 80% of all antibody-producing cells [1]. The gut microbiota is related to its contribution to host nutrition and metabolism. Recent research has revealed that the microbiota is also involved in the development and cognitive processes and microbial dysbiosis has been associated with several cognitive disorders, including autism [2]. Furthermore, Firmicutes, Bacteroidetes, Actinobacteria, and Proteobacteria are the four main phyla that makeup about 95% of the gut microbiota [3]. When an imbalance in the types of phyla occurs in the microbiome, many types of diseases may develop – i.e. autoimmune, metabolic, neoplastic, neurological, digestive, cardiovascular, and infectious diseases [4].
According to the scientific literature, there is an important influence of dietary patterns on the gut microbiota. Different types of polyphenols can alter the component of the microbiota, which in turn restricts the increase of pathogenic bacteria and raises the growth of probiotic bacteria (thus increasing diversity in the gut) [5]. Grape juice contains a large amount and variety of polyphenolic compounds and minerals such as potassium, calcium, magnesium and A, C and complex B vitamins that could improve the healthy gut microbiota [6,7].
The consumption of integral grape juice has grown significantly in Brazil. The state of Rio Grande do Sul (South Brazil), especially the region of “Serra Gaucha”, is an important producer of grapes and their derivatives. It is estimated that, in 2010, there were about 26.9 million liters of grape juice produced in the state [8]. With the passing of State Law No. 13,247/2009 in Rio Grande do Sul, grape juice is required to be supplied as a part of school lunches. Hence, each city has the autonomy to decide whether red grape juice will be offered to school children [9].
The development and maturation of the intestinal microbiome consists of a process influenced by several perinatal conditions, such as the mother’s age at pregnancy, type of feeding during pregnancy, type of delivery and family genetics. Babies born via vaginal delivery come into contact with the maternal vaginal and fecal microbiome, which results in neonatal intestinal colonization by microbes associated with the vagina such as Lactobacillus. In contrast, babies born via cesarean section are likely to be colonized by microorganisms from the mother’s skin, hospital staff and hospital environment [10].
The supply of breast milk at birth, in addition to providing essential nutrients for the growing baby, is a source of commensal bacteria that act on child health, preventing the adhesion of pathogens and promoting the intestinal colonization of beneficial microbes, where the strains derived from human milk can be considered potential probiotics for the health of the intestinal microbiome [11].
The promotion of adequate and healthy eating has numerous benefits and contributes to the developmental potential of a child in becoming a healthy adult with greater intellectual and productive capacity [12]. For this reason, the school environment is a strategic place to work on food and nutrition education, a good environment can be an effective tool for promoting healthy dietary habits in children [13].
Given the great number of studies and possible evidence in previous scientific researches, it is required to further investigate whether polyphenols, especially those found in integral red grape juice, were related to intestinal health and action in the dietary profile of school children.
Methods
This research is a cross-sectional study, in which two fulltime municipal schools with similar characteristics of two cities, in the South of Brazil, that offer integral red grape juice in school feeding were selected. A total of 36 volunteer schoolchildren between 6 and 10 years of age were included in the study, approved by the Research Ethics Committee, under serial number 2,983,917.
There were held meetings with training for parents and/or guardians who signed the Free and Informed Consent Form (FICF) and the children who signed the Free and Informed Consent Term (FICT).
The weight was measured using the Omron® digital scale HN289LA model, with capacity for 150 kg and graduations of 100 g. To measure the height, a wall stadiometer 2m Welmy® was used. To determine nutritional status through Body Mass Index (BMI), cutoff points were used through z-score, defined by the World Health Organization (WHO) [14]. To verify waist circumference (WC), an anthropometric steel tape was used, inextensible with 2m lock - Cescorf® and Freedman’s reference values, 1999 [15]. The triceps (TSF) and subscapular (SSF) skinfold thicknesses were performed with the traditional Cescorf® adipometer to define eutrophia or excess adiposity, through Frisancho’s cutoff points, 1990 [16].
To identify the dietary profile, the information was obtained through the Food Frequency Questionnaire (FFQ), validated by Del Pino, 2009 [17], which was filled in by parents and/or guardians and compared with that recommended by the Brazilian Society of Pediatrics (BSP) through portions of the Food Pyramid for preschoolers and school children [18]. Hence, it was defined an adequate consumption through the daily portions (cereals 5 portions/day, vegetables and vegetables 3 portions/day, fruits 3 portions/day, milk and derivatives 3 portions/day, meat and eggs 2 portions/day, legumes 1 portion/day, fats 1 portion/day and sugars 1 portion/day).
The acceptability of integral grape juice was evaluated through the Acceptability Test with facial hedonic scale [19], directly applied to volunteers.
The bacterial culture method was performed to evaluate the gut microbiota. Briefly, 1g of each stool sample was diluted in both 10 ml of BHI and thioglycolate broth and incubated by 48h at 37o C. Each sample was then plated using a selective and nonselective agar culture medium and measured after 48h of incubation at 37 oC. The results were expressed in colony-forming units per milliliter (CFU/mL) of stool. The colonies were identified by MALDI-TOF-MS and a microbial diversity was evaluated by calculating alpha diversity according to Shannon Index [20].
For statistical analysis of data with normal distribution, a t-test was used for independent samples, variables without normal distribution were evaluated by the U test. For group comparison, it was used ANOVA with Turkey’s post hoc test. A correlation between quantitative variables was also used. The statistical software Statistical Package for Social Science (SPSS®) version 22.0 was used for Windows. It was considered statistically different if p<0.05.
Results
The general characteristics of the 36 volunteer participants are shown in Table 1, in which 24 children are from City 1, with an average of 8.16 ± 0.86 years of age and 12 children are from City 2, with an average of 7.66 ± 1.23 years of age. The predominant race was the Caucasian (69.44%).
Table 1: Description of the general and anthropometric characteristics of the sample by cities (n=36).
Feature |
Frequency |
% |
Frequency |
% |
p* |
CITY 1 |
CITY 2 |
|
|||
Type of Delivery |
|
||||
Natural/vaginal |
15 |
62.5 |
5 |
41.6 |
0.006 |
Gestational Weeks |
|
|
|
||
Premature Birth |
0 |
0.0 |
- |
0.0 |
0.005 |
EB |
|
|
|
||
Yes |
14 |
60.0 |
5 |
50.0 |
0.705 |
Intestinal Habit |
|
|
|
||
Every day |
18 |
75.0 |
10 |
83.3 |
0.286 |
BMI rating |
|
|
|||
Underweight |
3 |
12.5 |
- |
0.0 |
0.099 |
WC Rating |
|
|
|||
Eutrophia |
20 |
83.3 |
9 |
75.0 |
0.557 |
TSF Rating |
|
|
|||
Decreased adiposity |
1 |
4.2 |
- |
0.0 |
0.432 |
SSF Rating |
|
|
|||
Decreased adiposity |
1 |
4.2 |
- |
0.0 |
0.277 |
Source: The authors, 2020.
Notes: EB, Exclusive Breastfeeding; BMI, Body Mass Index; WC, Waist Circumference; TSF, triceps skinfold; SSF, subscapular skinfold; %, Percentage.
*p: statistical significance <0.005, according to the Chi-squared test.
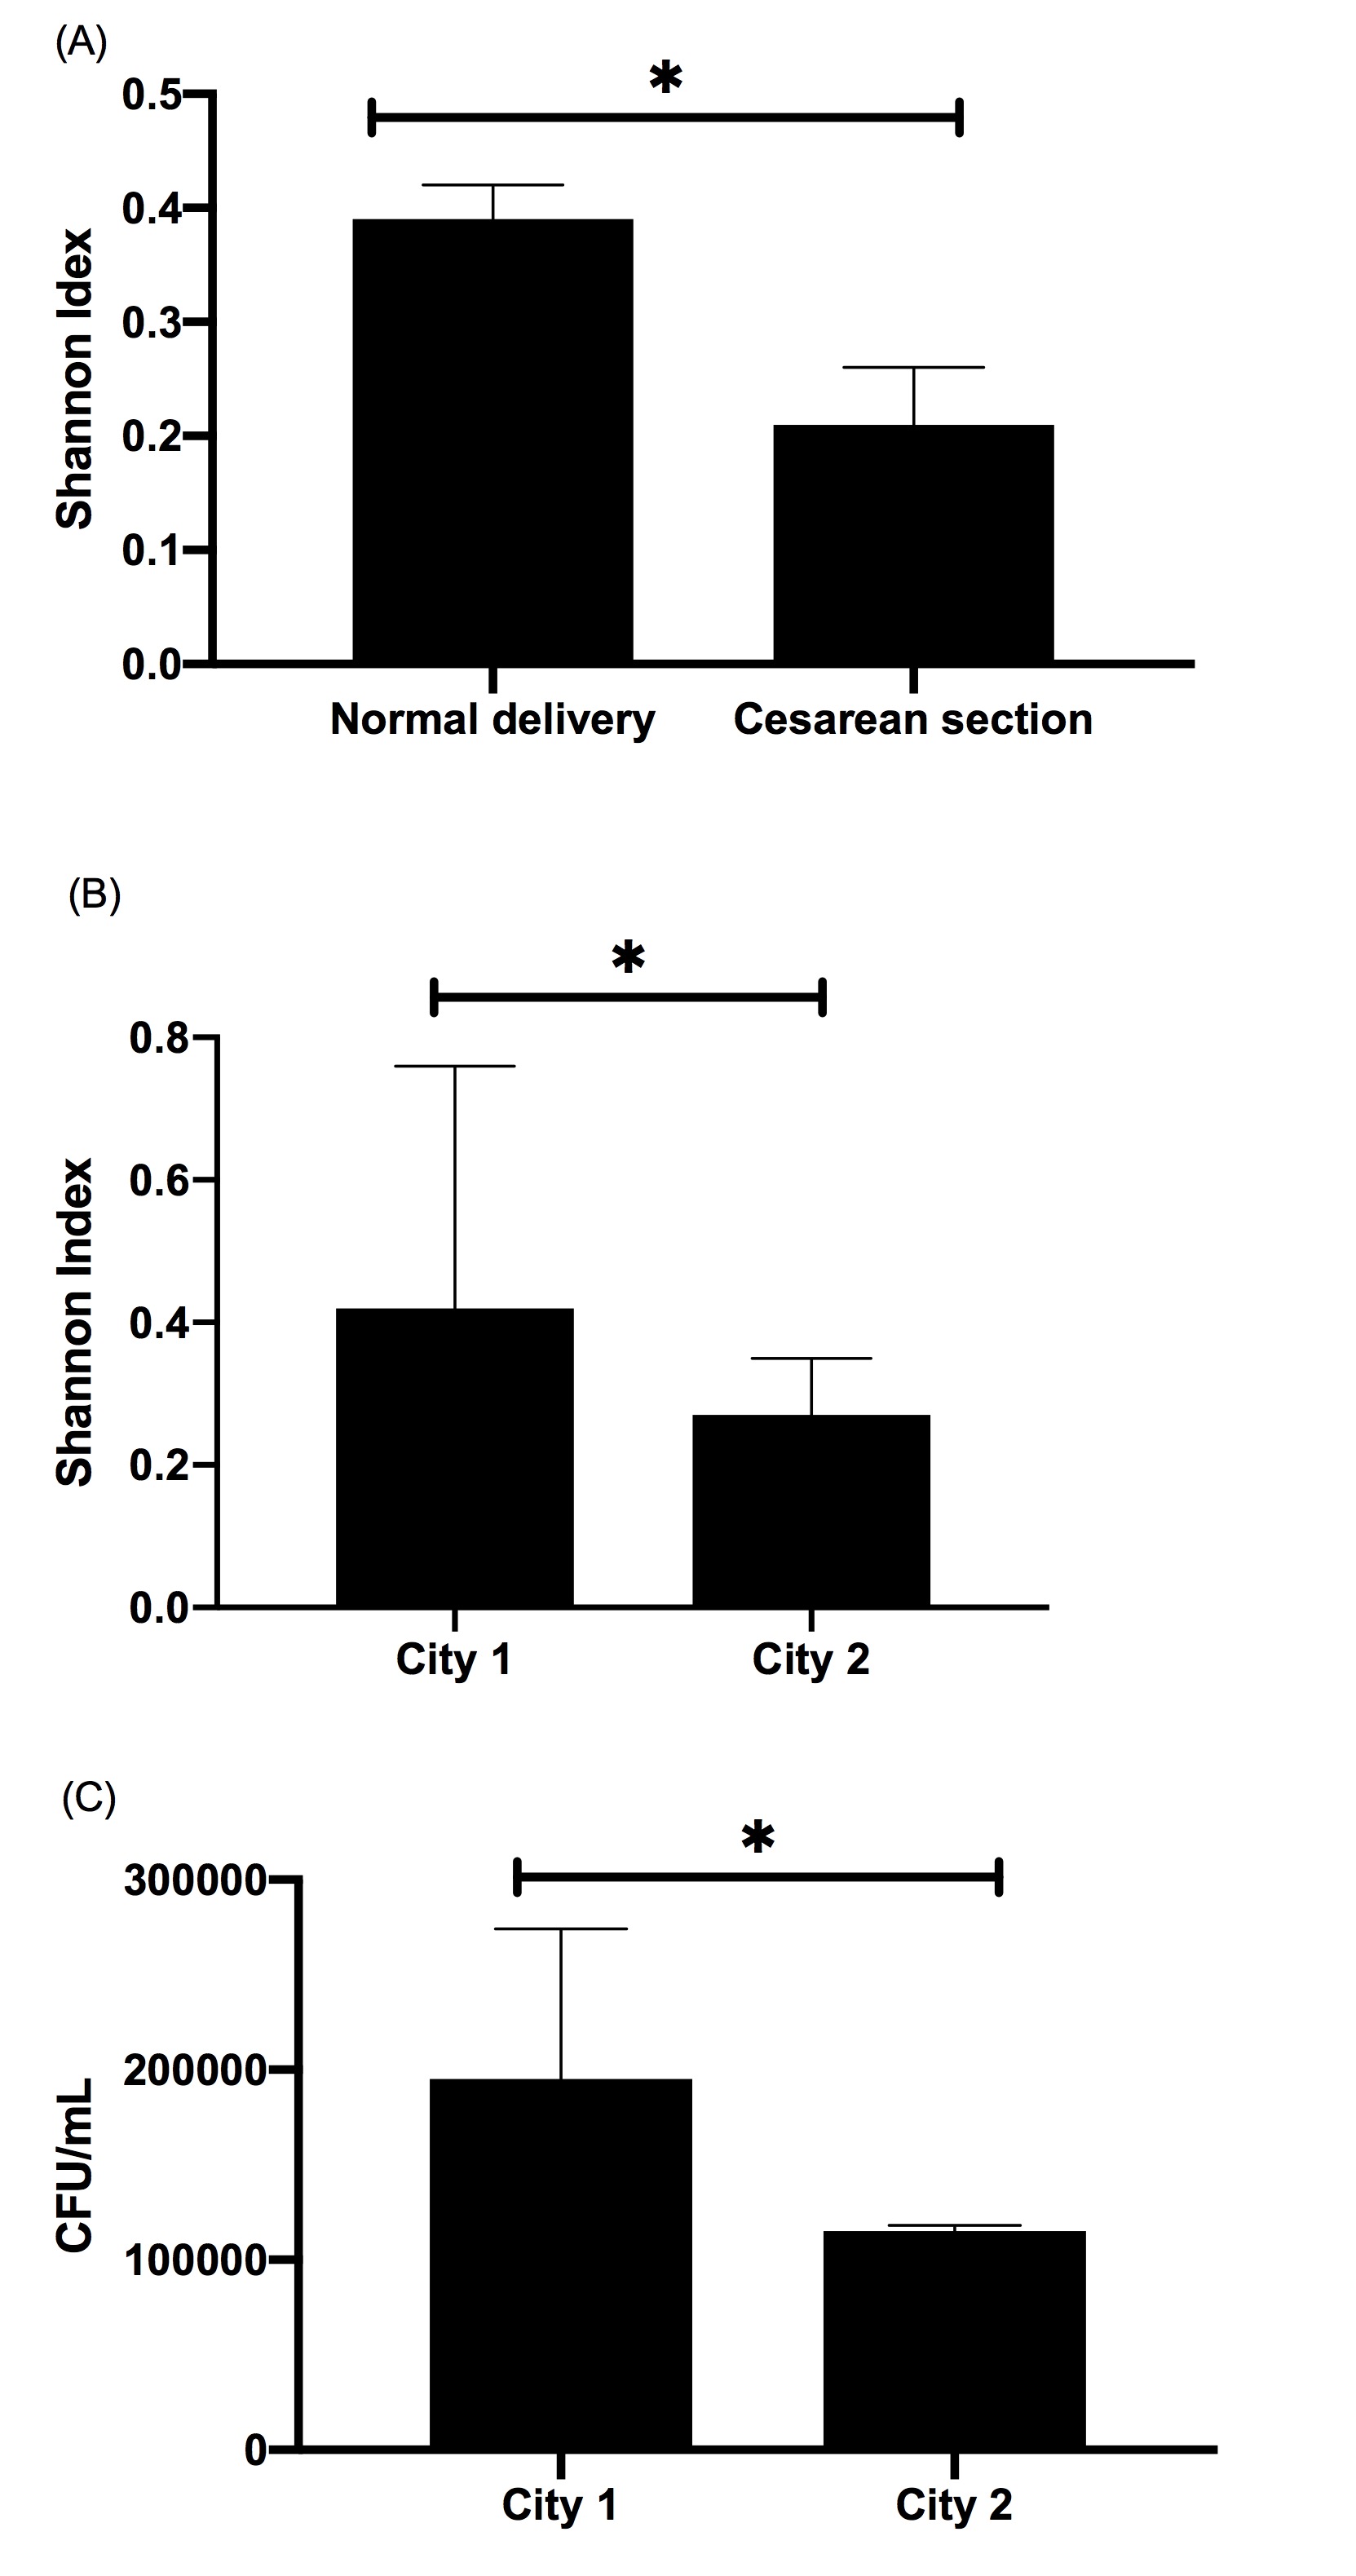
It is noteworthy that the majority of births, 58.3%, in City 2 were by a cesarean whereas the majority in City 1 were vaginal at 62.5%, this is a significant statistical difference, as shown in Figure 1A. Most births occurred in full-term gestational weeks, with an average of 38.26 ± 2.02 for City 1 and 38.16 ± 3.31 for City 2. Out of the total sample, only one child mentioned having a specific diet during the first 6 months after birth, which is lactose-free due to intolerance. The majority had exclusive breastfeeding, in City 1, 58.3%. However, in City 2, 58.3% of the children were not exclusively breastfed.
Anthropometric variables showed that both cities have a eutrophic nutritional profile, with an average height of 1.30 ± 0.99 m. However, 41.7% of the students in City 2 were overweight. As shown in Table 1, there was no significant difference in nutritional status between the samples. Normal adiposity is present in most students. In City 1 the mean WC was 59.27 ± 7.70 cm and in City 2 it was 60.20 ± 4.93 cm.
Considering the grape juice consumption, City 1 offers integral red grape juice once a week, about 180 ml (standard cup measure) in the school feeding menu and in City 2 the offer is held 2 times a week, about 360 ml/week. Acceptability is 86.1% for the students in the total sample.
In the family routine, integral grape juice is rarely present in both cities. The consumption of artificial powder juice is present in 26.1% daily, 52.2% once a week, 8.7% once a month, and 13% rarely in the City 1. In City 2, the following rates were found: 20% of daily consumption, 70% once to twice a week and 10% rarely.
When the frequency of daily consumption of polyphenols was analyzed, considering for grape juice intake and consumption of fruits and vegetables, which are sources of polyphenols, there was a statistically significant difference between the cities (p<0.003). In City 1, 57.1% have polyphenol consumption only once a week and 14.3% two to four times a week. In City 2, polyphenols consumption is from two to four times a week in 87.5% of the sample and for 12.5%, the consumption is daily.
The analysis of the usual diet reported by the FFQ showed that most of the sample(s) do(es) not include the daily intake of micronutrients and, in general,show higher consumption of macronutrients, such as cereals and fats, as recommended by BSP. It is worth mentioning that the ideal consumption of vegetables and legumes, milk and dairy products and meat and eggs is non-existent (0%) in City 2 (as shown in Table 2).
Table 2: Daily food intake of food groups by ideal portion according to the Food Pyramid for preschoolers and schoolchildren.
Food Group** |
Frequency |
% |
Frequency |
% |
p* |
|
CITY 1 |
CITY 2 |
|
||
Cereals |
6 |
28.6 |
3 |
37.5 |
0.779 |
Source: The authors, 2020.
Notes: *p: statistical significance <0.005, according to the Chi-squared test.
** portions per food group: cereals5 portions/day, vegetables 3 portions/day, fruits 3 portions/day, milk and derivatives 3 portions/day, meat and eggs 2 portions/day, legumes 1 portion/day, fats 1 portion/day and sugars 1 portion/day.
According to the questionnaire the children didn’t have habit to use probiotics and/or symbiotics, as well as medications such as antibiotics. This information is important because the use of these supplements or medications could alter the microbiota.
In City 1, 24 students participated in the study, out of which 54.2% (n=13) had the authorization of parents and or guardians to collect a stool sample. In City 2, out of 12 participants, 66.7% (n=8) of children delivered the stool sample.
Microbial diversity among cities was evaluated using alpha diversity by the Shannon Index, and indicated a higher microbial diversity in City 1 in comparison to City 2 (p<0.05), as shown in Figure 1B.
The number of bacteria by CFU/mL showed a statistical difference between the cities, as shown in Figure 1C.
Discussion
This is a study on nutritional status and influence on the dietary profile in the gut microbiota, in an attempt to identify possible effects of grape juice consumption since it is a regular offered meal in schools of both cities.
The frequency of supply of grape juice is different between the citiies, however there was no difference in relation to the statistics. In contrast, we have not detected an effect on gut microbiota diversity associate to it possibly due to the low consumption of micronutrients and highly consumption of refined carbohydrates and sugary drinks, according to the FFQ. Grape juice should be, as described in the legislation, 100% integral, natural, with no preservatives or sugar. Also, schools should offer juice in its natural form, without any sort of dilution, to take advantage of its full potential – following the prescription of the respective nutritionist. However, there is no effective municipal control to evaluate and evidence how this offer occurs in the school routine. This is an important bias to be highlighted in the current research.
The high consumption of artificial powder juice is worrisome since it does not add any nutritional value and is present throughout the entire studied sample. Vega (2015) found that 37.5% of the children in his study consumed artificial juice or soda four times a week [21]. Sugary drinks, such as artificial juice and soft drinks, are considered the most important contributors to the intake of too much sugar. Their regular consumption is pointed out as one of the main factors for unwanted weight gain [22]. In Brazil, overweight and obesity have been recorded in children as early as five years old within every income group and region [23]. Studies indicate that the main conditioning factors for obesity in children are the intake of products low in nutrients and high in sugar and fats, regular intake of sugary drinks and insufficient physical activity [24]. Besides that, the dietary profile of the volunteers was predominantly evidenced with low consumption of portions of fruits, vegetables, and dairy products. This same pattern was found in a study conducted by Berding (2018), which evaluated the dietary pattern and gut microbiota composition of children from 4 to 8 years of age. The author identified a higher than the recommended intake of fats, refined carbohydrates and sodium associated with low intake of fibers and proteins, thus resulting in a little different microbiota [25]. According to NSDH, daily consumption of fruits, vegetables and legumes, fresh or in juice, was not reported for four out of ten children. This low consumption is a relevant factor, especially as related to infant nutrition because fruits and vegetables are fundamental components of a healthy diet, essential for the normal growth, development, and maintenance of the human body during the life cycle [26].
In both cities most children have a eutrophic nutritional status. However, 41.7% of the children in the City 2 are overweight, which may point out to inadequate dietary patterns for this age. They may be happening possibly due to the nutritional transition that occurs in Brazil, which intensely affects the population with lower purchasing power [27].
Regarding the microbiota in volunteers from the City 2,the alpha diversity is lower, with a higher incidence of Firmicutes and lower of Bacteroidetes as have already reported by other studies [28,29]. It is noteworthy that the sample from City 2 presented a considerable percentage of overweight children. In a study held in Mexico with children between 6 and 14 years of age, the risk of being overweight was associated with the higher prevalence of Firmicutes and lower of Bacteroidetes. It have already been reported that the gut microbiota has an important effect on reducing the risk of developing obesity [30]. In a study with adults, individuals with low diversity of microbial phyla presented marked adiposity, insulin resistance and dyslipidemia, while individuals with greater richness of bacteria types had a healthy weight and better general clinical condition [31].
The low microbiota diversity found in volunteers from City 2 may still be attributed to inadequate micronutrient intake. However, the relationship between balance in gut microbiota, bacterial gut composition and dietary patterns in children is still not well understood and studies with children are lacking [32]. Another possible explanation may be the type of delivery and breastfeeding in the sample since cesarean deliveries have a decrease in the richness and diversity of the gut microbiota, that corroborates with infants without breastfeeding [33]. Studies have suggested that persistent differences in intestinal microbiota between children with cesarean delivery and vaginal delivery have been detected in children up to 7 years of age, highlighting the protective effect of vaginal delivery on long-term health [34]. Furthermore, it is worth mentioning that microbial diversity may have a genetic influence. This fact is believed to be due to family sharing, such as food and environment [35].
In a study with breastfed children who were followed up from birth to the first year of life, with stool sampling at 3, 6 and 12 months, alpha diversity showed that at 6 months there is a decline in diversity, possibly related to the time of food introduction. As they reach 12 months of age, the children presented a higher alpha diversity, including Bacteroidetes, Firmicutes, Fusobacteria, Proteobacteria, Actinobacteria and Verrucobiabia phyla [36]. This may suggest the beneficial action of breast milk on the diversity of the gut microbiota.
The consumption of polyphenols through the diet has a positive relationship with intestinal health, as well as the type of delivery and breastfeeding time, as shown in this current research. These results encouraged studdy more about these practices for the health of child and adult ones.
Implications for research and practice
Generally speaking, the results of this research highlight the positive relevance of the nutritional education of parents, society, educators and managers about the food offered to children in their family and school contexts. Considering that childhood is a paramount developmental stage for long-term health, it is essential to invest in nutritional education and recreational activities to encourage healthy eating habits that contribute positively to the prevention of obesity and its strong relationship with the composition of the gut microbiota.
Therefore, for the beneficial effects of grape juice consumption to be effective, the general nutritional context of the children must be adequate. Nonetheless, further studies with children and the relationship between feeding, polyphenol consumption and gut microbiota are necessary to better elucidate the remaining questions.
Funding: This work was supported by the National Council for Scientific and Technological Development (CNPq). There are no conflicts of interest.
References
- Duwehand A, Isolauri E, Salminen S. The role of the intestinal microflora for the development of the immune system in early childhood. European journal of nutrition. 2002; 41: i32-i37.
- Son JS, Zheng LJ, Rowehl LM, Tian X et al. Comparison of fecal microbiota in children with autism spectrum disorders and neurotypical siblings in the simons simplex collection. PloS one. 2015; 10: e0137725.
- Landman C, Quevrain E. Gut microbiota: Description, role and pathophysiologic implications. La Revue de medecine interne. 2016; 37: 418-423.
- Mimica MJ. Human microbiome: definition, main characteristics, and potential and therapeutic implications Medical Archive at Hospitals and Faculty of Medical Sciences of Santa Casa de São Paulo. 2018; 62: 42-45.
- Etxeberria U, Fernández-Quintela A, Milagro FI, Aguirre L, Martínez JA, Portillo MP. Impact of polyphenols and polyphenol-rich dietary sources on gut microbiota composition. Journal of agricultural and food chemistry. 2013; 61: 9517-9533.
- Shahidi F, Naczk M. Nutritional and pharmacological effects of food phenolics. In: Food phenolics: sources, chemistry, effects, applications. 1st ed. Lancaster, PA: Technomic Pub. Co; 1995: 171-91.
- Rizzon LA, Link M. Composition of homemade grape juice of different cultivars (Composição do suco de uva caseiro de diferentes cultivares). Ciência Rural. 2006; 36.
- Mello LMR. Brazilian viticulture: 2010 overview. Embrapa: Technical Articles. 2010.
- Law No. 11,947 of June 16, 2009. It provides for the attendance of school meals and the direct money program to primary education students; changes laws no. 10,880 of June 9, 2004, 11,273, of February 6, 2006, 11,507, of July 20, 2007; it also repeals provisions of provisional measure No. 2,178-36 of August 24, 2001, and Law No. 8,913 of July 12, 1994;
- Milani, Christian et al. The first microbial colonizers of the human gut: composition, activities, and health implications of the infant gut microbiota. Microbiology and molecular biology reviews. 2017; 81: 4.
- Lyons, Katríona E. et al. Breast milk, a source of beneficial microbes and associated benefits for infant health. Nutrients. 2020; 12: 4.
- Victora CG, Horta BL, De Mola CL et al. Association between breastfeeding and intelligence, educational attainment, and income at 30 years of age: a prospective birth cohort study from Brazil. The lancet global health. 2015; 3: e199-e205.
- Magellan HHSR, Porte LHM. Perception of children’s educators on food and nutrition education. Science & Education (Bauru). 2019; 25: 131-144.
- WHO Multicentre Growth Reference Study Group. WHO Child Growth Standards based on length/height, weight and age. In: De Onis M, Garza C, Onyango AW and Martorell R, Guest Editors – WHO Child Growth Standards, Acta Paediatrica. 2006; 95: 76- 85.
- Freedman DS, Serdula MK, Srinivasan SR, Berenson GS. Relation of circumferences and skinfold thicknesses to lipid and insulin concentrations in children and adolescents: the Bogalusa Heart Study. The American journal of clinical nutrition. 1999; 69: 308- 317.
- Frisancho AR. Anthropometric standards for the assessment of growth and nutritional status. University of Michigan Press. 1990.
- Vidor JA, Del Pino DL, Lembert CB et al. Adaptation and validation of a food frequency questionnaire for children aged 6 to 10, 2009.
- Brazilian Society of Pediatrics. Nutritional assessment of children and adolescents - Guidance Manual / Brazilian Society of Pediatrics. Brazilian Society of Pediatrics.Department of Nutrology. 2009.
- In Food, Collaborating Center. Manual for application of acceptability tests in the National School Feeding Program - NSFP. Santos: Federal University of São Paulo. 2010.
- Shannon CE, Weaver W.The Mathematical Theory of Communication. Illinois: Illini Books. 1998.
- Veja JB, Poblacion AP, Taddei JAAC. Factors associated with the consumption of sugary drinks among Brazilian preschoolers: a 2006 national survey. Science & Collective Health. 2015; 20: 2371-2380.
- World Health Organization. Report of the commission on ending childhood obesity. World Health Organization. 2016.
- IBGE (Brazilian Institute of Geography and Statistics). Family budget survey 2008-2009: Anthropometry and nutritional status of children, adolescents and adults in Brazil. Brazilian Institute of Geography and Statistics (IBGE). 2010.
- IBGE (Brazilian Institute of Geography and Statistics).Survey of family budgets 2002-2003. Anthropometry and analysis of the nutritional status of children and adolescents in Brazil. Brazilian Institute of Geography and Statistics (IBGE). 2006.
- Berding K, Holscher HD, Arthur AE, Donovan SM. Fecal microbiome composition and stability in 4-to 8-year old children is associated with dietary patterns and nutrient intake. The Journal of nutritional biochemistry. 2018; 56: 165-174.
- Krebs-Smith SM, Guenther PM, Subar AF, Kirkpatrick SI, Dodd KW. Americans do not meet federal dietary recommendations. The Journal of nutrition. 2010; 140: 1832-1838.
- Al Ani MF, Al Subhi LK, Bose S. Consumption of fruits and vegetables among adolescents: a multi-national comparison of eleven countries in the Eastern Mediterranean Region. British journal of nutrition. 2016; 116: 1799-1806.
- Brazil. Department of Health. National Survey of Demography and Health of Children and Women (PNDS 2006). Brasilia: MS. 2006.
- Vieira MDFA, Araújo CLP, Hallal PC et al. Nutritional status of students from 1st to 4th grades of elementary school in urban schools in the city of Pelotas, Rio Grande do Sul, Brazil. Public Health Notebooks,2008; 24: 1667-1674.
- Estrada-Velasco BI, Cruz M, García-Mena J et al. Childhood obesity as a consequence of the interaction between firmicutes and the consumption of foods with high energy content. Hospital Nutrition. 2015; 31: 1074-1081.
- Turnbaugh PJ, Hamady M, Yatsunenko T et al. A core gut microbiome in obese and lean twins.Nature. 2009; 457: 480-484.
- Azad MB, Konya T, Persaud RR et al. Impact of maternal intrapartum antibiotics, method of birth and breastfeeding on gut microbiota during the first year of life: a prospective cohort study. BJOG: An International Journal of Obstetrics & Gynaecology. 2016; 123: 983-993.
- Blake, Julie A. et al. The association of birth by caesarean section and cognitive outcomes in offspring: a systematic review. Social Psychiatry and Psychiatric Epidemiology, p. 1-13.) (AKAGAWA, Shohei et al. Effect of delivery mode and nutrition on gut microbiota in neonates. Annals of Nutrition and Metabolism. 2019; 74: 2.
- Goodrich JK, Waters JL, Poole AC et al. Human genetics shape the gut microbiome. Cell. 2014; 159: 789-799.
- De Oliveira FF. Analysis of the diversity of fecal microbiota of infants during the first year of life using 16S RNA library. PhD thesis. University of São Paulo. 2011.
- Prehn-Kristensen A, Zimmermann A, Tittmann L et al. Reduced microbiome alpha diversity in young patients with ADHD. PLoS One. 2018; 13.