
Journal of Clinical Images and Medical Case Reports
ISSN 2766-7820
Case Report - Open Access, Volume 2
The investigation of allergic skin diseases susceptibility
Prajwal Pandey1; Wei Min Shi2; Samir Shrestha3*
1 Assistant Professor, Department of Dermatology and Venereology, B.P. Koirala Institute of Health Sciences, Dharan, Nepal.
2 Department of Dermatology, Tong Ji University, Shanghai, China.
3 Junior Resident, Department of Dermatology and Venereology, B.P. Koirala Institute of Health Sciences, Dharan, Nepal.
*Corresponding Author: Samir Shrestha
Department of Dermatology and Venerology,
B.P. Koirala Institute of Health Sciences, Dharan,
Nepal.
Email: Shresthasambec731@gmail.com
Received : Sep 11, 2021
Accepted : Oct 15, 2021
Published : Oct 22, 2021
Archived : www.jcimcr.org
Copyright : © Shrestha S (2021).
Abstract
Background: Studies from around the world show that the prevalence and incidence of sensitization to allergens are higher in urban settings. Skin Prick Test (SPT) is being used more frequently now to investigate specific allergen sensitivity along with serum IgE level.
Objective: The objective of our study was to evaluate the prevalence of sub-clinical allergy susceptibility and to see association with gender, season, age, urticaria, eczema, dermatitis and total serum IgE.
Method and methodology: Eight hundred and ninety-two patients referred by dermatologist to rule out allergic sensitizations underwent SPT within one year. We calculated susceptible group and evaluated its ability to predict diseases like urticaria, eczema and non-specific dermatitis in general population.
Result: The antigens that had the highest prevalence throughout the year were Mould II (32.38%) and Dermatophagoides farina (33.78%). The susceptibility to allergen was affected by season and age, however was not affected by gender. The predictability was highly statistically significant for Urticaria, Eczema and Non-specific Dermatitis.
Conclusion: We conclude that the allergen susceptibility is high and is significantly correlated to the prevalence of allergic disorders in the sample population of a modern city like Shanghai. The susceptibility to allergen is affected by season and age.
Keywords: skin prick test; total serum IgE; sub-clinical allergy susceptibility.
Citation: Pandey P, Shi WM, Shrestha S. The investigation of allergic skin diseases susceptibility. J Clin Images Med Case Rep. 2021; 2(5): 1377.
Introduction
The skin and mucous membranes are most common organs involved due to allergic disease. Sensitivity threshold for different sensitizations differ in different individual, and that gives rise to the necessity of considering constitutional factors of an individual when dealing with skin hypersensitivity in that particular individual. Different studies have given varying results in concordance to the known individual risk factors for developing abnormal sensitivity to different sensitizers.
Skin Prick Test (SPT) is by far the most convenient, inexpensive and easy-to-handle tool for testing the sensitization of specific antigen in human, used widely for clinical confirmation of immediate hypersensitivity induced by variety of naturally occurring allergens [1]. They are frequently used as reference standards for evaluating specificity and sensitivity of specific in vitro tests for IgE. Prick test is also considered a safe method of allergy testing [2]. Measurements of total serum IgE concentration are of modest clinical value when used as a screen for allergic disease or for predicting the risk of allergic disease. There is also a suggestion that the serum IgE concentration is an indicator of disease activity and that serial determinations should be used to evaluate the adequacy of treatment [3]. The precise sensitivity of these immunoassays compared with prick/ puncture skin tests has been reported to be 70% to 75% for most studies [4,5]. In many situations, skin tests are therefore the most clinically useful tests for the diagnosis of IgE-mediated sensitivity.
Methods and methodology
A cross sectional prospective study was performed, 936 patients were found eligible and referred for Skin Prick Test (SPT) screening by our physicians attending dermatology clinic at the Department of Dermatology and Venereology at Tongji University, Shanghai China between January to December 2008. Among the patients, only 892 were enrolled in our study after taking written, well informed consent. Other participants were excluded due to incomplete data, having antihistaminic medication at least 3 days before the test or severe dermographism. Information of patients were noted down, including their age, sex, preliminary diagnosis by attending dermatologists and history of urticaria, dermatitis and eczema.
In this study, we selected 22 specific allergens for SPT screening. These 22 allergens were selected according to the diversity in general population of Shanghai and they ranged from food allergens to environmental allergens. The 22 allergens selected were: Peanut, cow’s milk, egg, tuna fish, shrimp, lobster, pineapple, animal dander and epithelium II, cat dander, dog epithelium, mould II, tree I, tree II, lilac flower, willow, Gramineae, weeds, cereal, mugwort, hay dust, Dermatophagoides farina and Dermatophagoides pteronyssinus.
Skin prick test on the individuals we enrolled was conducted by trained medical workers in our diagnostic laboratory and the assay of specialized allergens was from Allergopharma® (Germany). The volar aspect of the forearm was the test site, and in case of dermatitis on the arm, the back was selected. Hypodermic needle was pricked through the allergen droplet and wiped thoroughly with alcohol before the 2nd prick. Negative control (saline) was pricked first and positive control (10-mg/mL histamine dehydrochloride) was pricked last. There was approximately 2 to 2.5 cm space between each applied allergen, and tests were not placed in areas 5 cm from the wrist or 3 cm from the antecubital fossae.
These results were noted down according to the wheel size as per the guidelines provided by Allergopharma® (Table 1). We then interpreted and categorized the data as ‘0’ being negative, ‘1+’ being sub-clinical susceptible, ‘2+’ being mildly sensitive,’ 3+’ being moderately sensitive and ‘4+’ being highly sensitive. In order to keep things simple, and more predictive for future consultations, we further divided the results into three groups, ‘negative’, ‘sub-clinical susceptible’ and ‘positive’. From the prick test results so obtained, we put all the non-sensitized in the category of ‘negative’. This group had a negative result to all the allergens tested from our panel. The patients that had 2+ and above value of sensitization to either one or more than one of the allergens so tested were categorized as ‘positive’, and those who had their prick test result equivalent to only 1+ to either one or more than one of the allergens so tested were grouped as ‘susceptible’. Monthly average concentration of continues metric value for total serum IgE with SI unit was taken and compared to the monthly average value of both the ‘positive’ and ‘susceptible’ SPT patients’ groups of the same year. Linear regression analysis between the groups was performed in order to calculate its predictability in the general population.
Statistical analysis was performed using the IBM SPSS software version 10.5. Continuous variables were expressed as the mean or medians whereas categorical variables were expressed as number. Normality of continuous variables was analyzed by using a Kolmogorov–Smirnov test. The t test, chi-squared test, Pearson’s correlation analysis statistically analyze the data from the patients. Linear regression analysis was performed between the monthly average value of the patients with total serum IgE to both the SPT groups categorized as ‘positive’ and ‘susceptible’. P value of <0.05 was considered statistically significant.
Table 1: Applied equivalence of the old and new measuring scale for SPT
Old “+” scale |
Wheal size (mm) |
Interpretation |
0 |
<4 |
Negative |
1+ |
4-5 |
Sub-clinical Susceptible |
2+ |
5-10 |
Midly Sensitive |
3+ |
10-15 |
Moderately Sensitive |
4+ |
>15 |
Highly Sensitive |
Results
We enrolled 892 people in our study. The allergen susceptibility of the patients was evaluated with skin prick test for 22 specific allergen that showed highest susceptibility with dermatophagoides farina (33.77%) followed by mould (32.38%), hay dust (25.20%) and tree I (24.78%) respectively (Table 2).
Prevalence of allergen susceptibility as per various factors
Clinical allergen susceptebility was higly prevalent among 20 to 30 years age group with relative frequency of 23% and 27.77% for ‘susceptible’ and ‘positive’ groups respectively. On comparing the prevalence percentage of subclinical susceptibility as per gender, no distinct difference was observed. Allergen susceptibility as per the season showed that the susceptibility prevalence was lowest in the winter season which started to increase slowly as the weather became warmer and from the beginning of spring season the prevalence started to increase gradually till it reached the highest peak in April and May. The prevalence trend started to fall down as the summer came to an end with lowest point in August, which then started to rise again to make a 2nd peak in September (Figure 1).

Table 2: General allergen susceptibility in the sample of patients
Allergens |
Prevalence (%) |
peanut |
22.28 |
cow’s milk |
23.14 |
egg |
22.30 |
tuna fish |
21.61 |
shrimp |
23.53 |
lobster |
22.82 |
pineapple |
23.80 |
animal dander and epithelium II |
22.62 |
cat dander |
24.55 |
dog epithelium |
22.50 |
mould II |
32.38 |
tree I |
24.78 |
tree II |
23.22 |
lilac flower |
24.34 |
willow |
24.38 |
Gramineae |
22.16 |
weeds |
24.50 |
cereal |
23.47 |
mugwort |
23.77 |
hay dust |
25.20 |
Dermatophagoides farina |
33.77 |
Dermatophagoides pteronyssinus |
23.67 |
Prevalence prediction for urticaria, eczema and dermatitis as opposed to allergen susceptibility
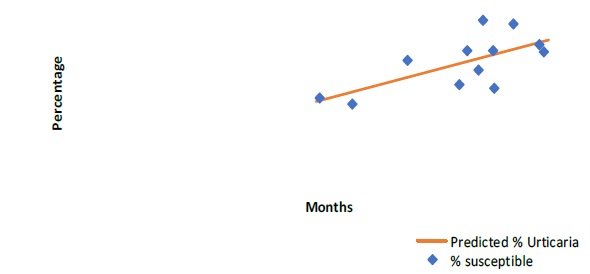
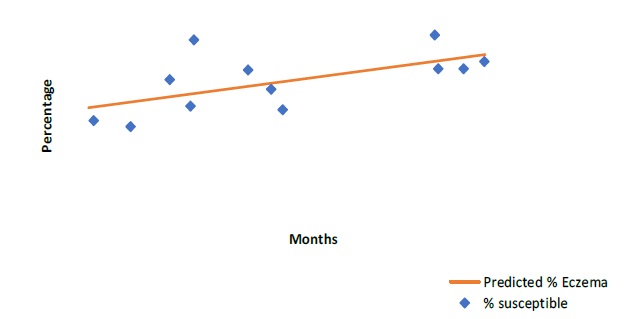
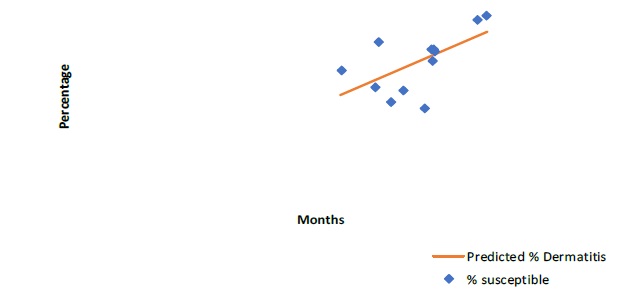
Prevalence prediction for urticaria (p=0.015), eczema (p=0.035) and dermatitis (p=0.04) showed statistically significant correlation with allergen susceptibility (Figure 2, 3 & 4).
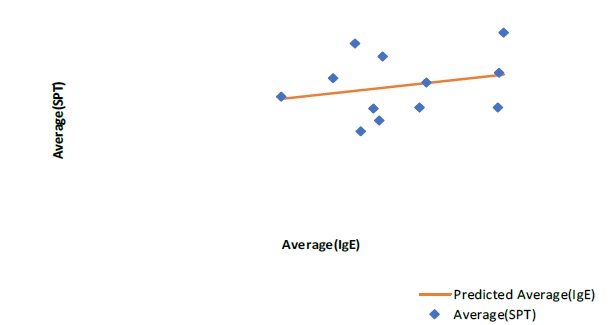
Total serum IgE concentration and allergen susceptibility
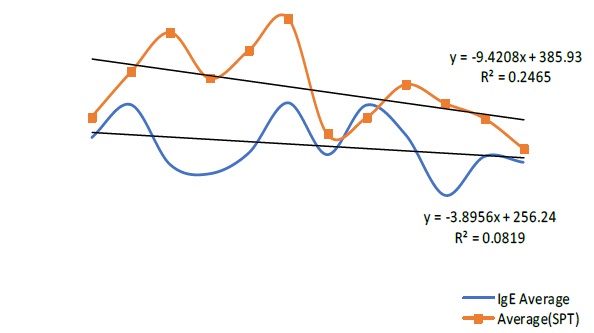
Our study showed a statistical significant correlation between the total serum IgE and allergen susceptibility (p = 0.035) (Figure 5). Further to confirm the fact, we compared the trend of total serum IgE (tIgE) and SPT ‘positive’ group according to the months of the year which showed positive correlation (Figure 6).
Discussions
The general prevalence of self-perceived allergy susceptibility in human has increased drastically in recent decades. Our study also showed the increased prevalence of allergy susceptibility with the prevalence of more than 20% for every allergen tested. Top two prevalent allergen in our study were Dermatophagoides farina (33.78%) and Mould II (32.39%). Mould and house dust mite are probably the most common allergens prevailing in modern world as shown by many studies also. The prevalence of allergy susceptibility is in increasing trend as shown by Linneberg et al., and International Study of Asthma and Allergies in Childhood (ISAAC). One of the cause of increasing prevalence might be due to increasing rate of urbanization. Decreasing rate of early childhood infection may have contributed to the increasing indoor sensitization as stated by the ‘hygiene hypothesis’. The increase in the prevalence of atopy might be next contributing factor. The increase in sensitizations with a change in life style due to modernization documented in Germany showed similar results too, all the facts supporting that modernization in itself could be one of the important risk factors in allergen sensitization.
Our result was in concurrence with other studies that showed peaks in allergic diseases in these months of April-May and September [6-8]. This result is also verified by the fact that early April and September are the beginning of spring and autumn seasons, which is associated with high air-borne pollens as most of the flowers, grasses and trees start pollinating at this period. A study of such pollination and air-borne allergen susceptibility in southern Chinese school children also support our result [9,10]. Many studies have done their research on month of birth and pollinosis, giving to early or later sensitization in their lives [11-18].
Our study showed positive correlation between the subclinical susceptibility (susceptible) and the clinical sensitization (positive) for various kinds of allergens. This might be because of increase in sensitivity, the average vulnerable group is increasing too.
We further found that there was statistically significant positive correlation predictability of our calculated susceptible group for common hypersensitivity related disorders like Urticaria, Eczema and Dermatitis. The findings show that as the susceptibility for common allergens increases, the prevalence of allergen related sensitivity increases too.
Total serum IgE is known to be elevated in different diseases including infection, parasites and IgE-mediated allergy. Although epidemiologic studies have shown that the risk of allergy is highly correlated with the total serum IgE concentration, the variation from individual to individual is too great to provide much diagnostic value [19-26]. Since the discovery of IgE, it has been used and associated many times to relate with type I hypersensitivity and since specific IgE were calculable, its relation with specific allergen sensitization has been proved over and over again. Our study showed that with the average increase in SPT susceptibility, the average in total serum IgE also increases. Though the SPT group were not the same as IgE group, we can safely assume that the range of total serum IgE concentration used in our study widely represents the general population of that area. A rise or a fall in such concentration can only represent a rise or a fall in the well-being of an individual’s constitution. In other words, the constitutional factors of an individual have a role play in the increase or decrease in that particular individual’s clinical manifestations for any disorders, allergic disorders being an important one. Furthermore, our study demonstrated almost parallel correlation between the two curves of SPT and tIgE. This result gives support to the fact that while the SPT susceptibility is increasing or decreasing with different seasons, an individual’s vulnerability demonstrated by total serum IgE is also going through similar pattern. Since tIgE is known to increase in diseases other than just allergic disease, it supports the fact that the particular individual is already vulnerable and more susceptible to diseases including allergic disorders.
It was found in our study that both the subclinical susceptibility and positivity to sensitization follow a similar pattern, reaching its peak at the age group 20-29 and declining all the way. Another study had concluded that prevalence of positive skin test results increases until the third decade, after which there is a slow decline, particularly after the age of 50 years [26].Nevertheless, significant positive skin test results may still be demonstrated in patients well older than 65 years. The prevalence comparison of subclinical susceptibility in male and female did not show an obvious difference in its pattern for past 12 months in our study. This result is also in agreement with previous studies that came out with no statistical difference between the two genders [27].
Conclusion
The study showed that prevalence of allergic susceptibility is high in the urban setting and is affected by season variation. The prevalence prediction for urticaria, eczema and dermatitis showed statistically significant correlation with allergen susceptibility. There is significant correlation between the total serum IgE and allergen susceptibility
Limitations of the study
The study was done in a single ethnic group without control. The allergen extracts provided to us by Allergopharma has not been tested for its potency and deterioration with time. The difference in such potency might have resulted in false negativity to our sample tested, which might have given to a lower rate of the subclinical susceptibility calculated.
Declarations
Conflict of interest disclosure: The authors have no conflicts of interest.
Funding sources: None
Ethics disclosure: A written consent was obtained from the parents of the patient for the publication of the case and images.
Author declaration: All persons designated as authors contributed substantially to this work to take public responsibility for appropriate portions of the content. Furthermore, each author certifies that this material or similar material has not been and will not be submitted to or published in any other publication. All authors have read and approved the final version to be published.
References
- Pirquet C von. Allergie. Münch Med Wochenschr. 1906; 30: 1457.
- Simons E (ed). Ancestors in allergy. Global Med Com, New York. 1994.
- Fuchs E, Schadewaldt H. Portraits: Karl Hansen, Allergo J. 1993; 2: 80-81.
- Sarbjit S. Saini and Donald MacGlashan. How IgE upregulates the allergic response. Current Opinion in Immunology 2002; 14: 694-697.
- GALLI SJ. The mast cell: A versatile effector cell for a challenging world. International archives of allergy and immunology. 1997; 113: 14-22.
- Agner T, Serup J. Seasonal variation of skin resistance to irritants. British Journal of Dermatology. 2006; 121: 323-28
- Ciprandi G, Vizzaccaro A, Cirillo L, Crimi P, Canonica GW. Increase of asthma and allergic rhinitis prevalence in young Italian men. Int Arch Allergy Immunol. 1996; 111: 279–83.
- Karakaya G, Kalyoncu AF. The natural course of atopy determined by skin prick tests in patients with bronchial asthma and/ or rhinitis. Allergologia et immunopathologia. 2006.
- Zhong NS, Chen RC, O-yang M, Wu JY, Fu WX, et al. Bronchial hyperresponsiveness in young students of southern China: Relation to respiratory symptoms, diagnosed asthma, and risk factors. Thorax 1990; 45: 860-865.
- Leung R, Jenkins M. Asthma, allergy and atopy in southern Chinese school students. Clinical & Experimental Allergy. 2006; 24: 353 – 358.
- Businco L, Cantani A, Farinella F, Businco E. Month of birth and grass pollen or mite sensitization in children with respiratory allergy: A significant relationship. Clinical & Experimental Allergy. 2006; 18: 269 – 274.
- Reed CE. The failure of antepartum or neonatal exposure to grass pollen to influence the later development of grass sensitivity. J Allergy. 1958; 29: 300–301.
- Kleiner H, Arkins JA, Lauwasser M. Correlation between date of birth and pollen sensitivity. Ann Allergy. 1975; 34: 310–314.
- Soothill JF, Stokes CR, Turner MW, Norman AP, Taylor B. Predisposing factors and the development of reaginic allergy in infancy. Clin Allergy. 1976; 6: 305–319.
- Troise C, Voltolini S, Delbono G, Ebbli A, Negrini AC. Allergy to Parietaria pollen and month of birth. Allergol Immunopathol (Madr) 1989; 17: 201–204.
- Vovolis V, Grigoreas C, Galatas I, Vourdas D. Is month of birth a risk factor for subsequent development of pollen allergy in adults? Allergy Asthma Proc. 1999; 20: 15–22.
- Saitoh Y, Dake Y, Shimazu S, Sakoda T, Sogo H, et al. Month of birth, atopic disease, and atopic sensitization. J Investig Allergol Clin Immunol. 2001; 11: 183–187.
- Guerra S, Sherrill DL, Cottini M, Michetti G, Allegra L. On the association between date of birth and pollen sensitization: Is age an effect modifier? Allergy Asthma Proc 2002; 23: 303–310.
- Barbee RA, Halonen M, Kaltenborn W, et al. A longitudinal study of serum IgE in a community cohort: correlations with age, sex, smoking and atopic status. J Allergy Clin Immunol. 1987; 79: 919 –927.
- Brown WG, Halonen MJ, Kaltenborn WT, et al. The relationship of respiratory allergy, skin test reactivity and serum IgE in a community population sample. J Allergy Clin Immunol. 1979; 63: 328 –335.
- Burrows B, Martinez FD, Halonen M, et al. Association of asthma with serum IgE levels and skin-test reactivity to allergens. N Engl J Med. 1989; 320: 271–277.
- Sampson HA, Ho DG. Relationship between food-specific IgE concentrations and the risk of positive food challenges in children and adolescents. J Allergy Clin Immunol. 1997; 100: 444 –51.
- Buckley RH. Immunologic deficiency and allergic disease. In: Middleton E Jr., Reed CE, Ellis EF, eds. Allergy Principles and Practice, 4th ed. St. Louis: Mosby Year Book 1993; 1007–26.
- Sample S, Chernoff DN, Lenahan GA, et al. Elevated serum concentrations of IgE antibodies to environmental antigens in HIV seropositive male homosexuals. J Allergy Clin Immunol. 1990; 86: 876–880.
- Sampson HA, Ho DG. Relationship between food-specific IgE concentrations and the risk of positive food challenges in children and adolescents. J Allergy Clin Immunol. 1997; 100: 444 –51.
- Barbee RA, Halonen M, Lebowitz M, Burrows B: Distribution of IgE in a community population sample: correlations with age, sex, and allergen skin test reactivity. J Allergy Clin Immunol. 1981; 68: 106-111.
- Ahlholm JU, Helander ML, Savolainen J. Genetic and environmental factors affecting the allergenicity of birch [Betula pubescens ssp. Ezerepanovii (Orl.) Hamet-ahti] pollen. Clin Exp Allergy. 1998; 28: 1384–8.