
Journal of Clinical Images and Medical Case Reports
ISSN 2766-7820
Case Report - Open Access, Volume 2
Predicting mortality rate in ICU admitted COVID-19 patients implementing visual semi-quantitative CT severity scoring system
SJavid Azadbakht1*; Motahare Akbari2
1 Department of Radiology, Faculty of Medicine, Kashan University of Medical Sciences, Kashan, Iran.
2 Faculty of Medicine, Kashan University of Medical Sciences, Kashan, Iran.
*Corresponding Author: Javid Azadbakht
Department of Radiology, Faculty of Medicine, Kashan
University of Medical Sciences, 8715981151, Shahid
Beheshti Hospital, Qotb Ravandi Blvd, Kashan, Iran.
Email: Javidazadbakht2@gmail.com
Received : Oct 25, 2021
Accepted : Dec 13, 2021
Published : Dec 20, 2021
Archived : www.jcimcr.org
Copyright : © Azadbakht J (2021).
Abstract
Objectives: The aim of this study was to identify the clinical and laboratory features and CT scan (CT intensity score and pleural effusion) associated with COVID-19 pneumonia to evaluate the relationship between CT scan findings and mortality by comparing deceased patients with normal patients.
Methods: In this retrospective case-control study, 290 ICU admitted patients with RT-PCR confirmed COVID-19 pneumonia were investigated. Totally, 150 deceased patients (with confirmed COVID-19 related death) were extracted from the COVID-19 registry of the affiliated university hospital belonging to mentioned period of time (in-hospital mortality subgroup, case), and 150 patients who survived the admission course were randomly selected from the same data set (surviving subgroup, control). Available electronic records for each patient were enlisted, including laboratory and clinical information, and their on-admission Computed Tomography (CT) images were reviewed. Mortality-related risk factors were compared between case and control subgroups.
Results: The mean age of deceased patients (68.20 ± 16.07) was significantly higher than that of the surviving patients (54.72 ± 19.50) (p<0.001). Diabetes, hypertension, and Chronic Kidney Disease (CKD) were significantly related with higher mortality rates (62.2%, 58.7%, and 80.4% mortality in diabetic, hypertensive, and CKD patients versus 41.7%, 42.1%, and 35.9% in non-diabetics, normotensives, and patients without CKD). Additionally, the mean on-admission air-room SPO2 level in deceased patients (90%) was significantly lower than that of the survivors (93%) (p = 0.001). Lymphocyte count, Neutrophil to Lymphocyte Ratio (NLR), Erythrocyte Sedimentation Rate (ESR), CReactive Protein (CRP), Lactate Dehydrogenase (LDH), Fasting Blood Sugar (BS), Blood Urea Nitrogen (BUN), and Creatinine (Cr), mean CT Severity Score (CT-ss), and O2 supportive therapy requirement were significantly higher in the mortality subgroup (p<0.05). Pleural effusion showed no significant correlation with short-term mortality. CTss of >11, in isolation or in combination with above-mentioned prognosticators, was 64% or 81.4% sensitive, and 60% or of 78.6% specific, to predict mortality.
Conclusions: Factors such as advanced age, underlying diseases such as diabetes, hypertension, and CKD, decreased air-room SPO2 , and increased lymphocyte count, higher NLR, ESR, CRP, LDH, BS, BUN, and Cr level, as well as higher CT-ss and O2 supportive therapy, are all significantly correlated with higher mortality in ICU-admitted COVID-19 patients.
Keywords: COVID-19; CT scan; CT Severity score; ICU; pneumonia.
Citation: Azadbakht J, Akbari M. Predicting mortality rate in ICU admitted COVID-19 patients implementing visual semiquantitative CT severity scoring system. J Clin Images Med Case Rep. 2021; 2(6): 1493.
Introduction
In Dec 2019, a series of pneumonia cases linked to a seafood and wet animal wholesale market emerged in Wuhan, Hubei, China [1]. Deep sequencing analysis from lower respiratory tract samples indicated a novel coronavirus, which was named 2019 novel coronavirus (2019-nCoV) [2], which after about 20 whole months yet represents a major threat to global health. Severe acute respiratory syndrome coronavirus 2 (SARS-CoV-2), a new virus responsible for multiple outbreaks of respiratory illness known as COVID-19 throughout the world, has sickened more than 240 million people and killed nearly 5 million patients as of 22 Oct, 2021 [3]. The clinical spectrum of COVID-19 pneumonia ranges from mild to critical cases, among which the diagnoses of ordinary, severe, and critical cases were all correlated with chest computed tomography (CT) findings [4,5]. WHO had declared that this situation should be deemed a public health emergency of international concern on 30 Jan 2020 [6]. Major clinical and paraclinical features of patients with 2019-nCoV Induced Pneumonia (NCIP) include fever and/or respiratory illness, lymphopenia, and radiologic abnormality [6-8]. Computed Tomography (CT) is capable of accurately assessing the condition of the lungs’ parenchyma and is available in many medical centers worldwide [9]. Chest CT scan is relatively sensitive for detecting the initial evidence of COVID-19 pneumonia, which crucially helps to increase the effectiveness of early-onset therapy. In asymptomatic or mildly symptomatic COVID-19 patients in the early stages of the disease, CT scan plays an vital role in timely diagnosis [5]. Moreover, CT may help to predict the final prognosis early in the disease course.
Here with, we investigated 290 ICU-admitted RT-PCR confirmed COVID-19 patients into two 150 mortality and surviving subgroups, describing the clinical, laboratory, and radiological characteristics and comparing the results between these two subgroups.
Methods and materials
This study was approved under a waiver of informed consent by the Institutional Review Board (IRB).
Study population
This retrospective study was performed between 20 Feb, 2020 and 21 June, 2020 in a tertiary teaching center in an early epicenter of COVID-19. Medical records of 290 eligible ICUadmitted RT-PCR confirmed COVID-19 patients who underwent chest CT scan on admission date were extracted. In general, 145 patients deceased in admission course (case); to design a casecontrol analysis and increase the study power, we used a 1:1 ratio of control, investigating 150 surviving patients discharged after significant clinical recovery (control). Patients with an underlying pulmonary disease, potentially capable of confounding CT images interpretation (pulmonary fibrosis and emphysema), and patients with positive blood culture for other infectious agents, causative of pneumonia, and patients with chest CT images taken with technical errors (artifacts) were excluded from the study.
Clinical and laboratory findings
Duration of hospitalization, presence of COVID-19 related symptoms, the time interval between symptom onset and admission date (same as the time interval between symptom onset and initial chest CT), on-admission respiratory rate and air-room SPO2 , need for O2 supportive therapy (through nasal cannula or mechanical ventilation) were noted. In addition, the presence of underlying diseases such as DM, HTN, heart disease, chronic kidney and liver disease, and malignancies were recorded. WBC (White Blood Cell) count, neutrophil count, lymphocyte count, NLR, ESR, CRP, LDH, Creatinine Phosphokinase (CPK), Aspartate Aminotransferase (AST), Alanine Transaminase (ALT), troponin, BUN, Cr, BS, and history of long-term (at least for three months) glucocorticoids administration were also enlisted.
Image acquisition
All CT scans were performed using a multi-slice scanner (Alexion TSX-034A, Toshiba, Japan) at maximum inspiration affordable by patients, hands up and in the supine position, without prescribing intravenous contrast material. CT parameters were set as per the local institutional low-dose CT protocol: Pipe voltage: 120kVp; tube current: 100 mA with automatic exposure control, slice thickness: 3 mm, step coefficient: 1. The mean CTDIvol was 5.1 mGy (range: 3.8-7.8 mGy). Low-dose CT has been found to substantially decrease the radiation exposure in both CT department staff and patient without compromising NCIP detection in CT [10].
Image interpretation
Two radiologists examined chest CT images independently, obviating mismatches with a consensus approach. All included chest CTs were randomly encoded and anonymously identified by colleagues who were not involved in this investigation to blind contributing authors to the final result. All CT images were viewed in lung window settings (WW, 1600 HU; WL, 50550 HU) to calculate semiquantitative CT severity score and mediastinal window setting (WW, 400 HU; WL, 40 HU) to evaluate the presence of pleural effusion.
Affected pulmonary lobes were recorded (upper right lobe, right middle lobe, right lower lobe, upper left lobe, and lower left lobe). A semiquantitative CT Severity Scoring (CT-ss) system has been used to visually estimate the extension of pulmonary involvement in each lobe and assign a score to every lobe (ranging between 0-5), and then adding up five different lobe scores to give the overall CT-ss (ranging between 0-25), as implemented in previous studies [11,12]: Score 0, no lobar involvement; score 1, 1% - 5% lobar involvement; score 2, 6% - 25% lobar in-volvement; score 3, 26%-50% lobar involvement; score 4, 51%- 75% lobar involvement; and score 5, 76%-100% lobar involvement. The presence and severity of pleural effusion (minimal, mild, moderate, severe) were also recorded.
Statistical analysis
Data were first collected and entered into SPSS software version 22, using descriptive statistics (frequency distribution and central indices and dispersion) and inferential statistics (t-test to compare the mean of quantitative variables between survived and deceased patients, and Chi-square test to analyze the relationship between categorical variables and patient mortality). Significant predictors were then identified using the univariate model. In the next step, the multivariate conditional logistic regression model was used to design a model indicating the relationship between considered variables and patients mortality rate. Only variables with a p-value of less than 0.25 were included in the model. The results of the Omnibus test are acceptable model fit and significant at an error level of less than 0.001. After determining the significant predictor (s), the sensitivity and specificity (accuracy) of predicting mortality was measured for the CT-ss alone and with other model predictors through analyzing ROC curves.
Results
In this study, medical records/chest CT images of 290 RT-PCR confirmed ICU admitted COVID-19 patients (145 surviving admission course and 145 deceased in hospital) were reviewed and enlisted.
Table 1
Table 1:
p-value |
Deceased patients |
Survived patients |
Total |
Variable |
|||
.158 |
61 (45.2) |
74 (54.8) |
135 (46.6) |
Male |
Gender |
Demographic |
|
.000 |
68.20±16.07 |
54.72±19.50 |
61.46±19.08 (3-99) |
Age |
|||
.001 |
72 (62.6) |
43 (37.4) |
115 (39.7) |
Yes |
DM |
Comorbidities |
|
.007 |
81 (58.7) |
57 (41.3) |
138 (47.6) |
Yes |
Hypertension |
||
.710 |
47 (48.0) |
51 (52.0) |
98 (33.8) |
Yes |
Heart disease |
||
.000 |
74 (80.4) |
18 (19.6) |
57 (62.0) |
Acute |
Yes |
CKD |
|
198 (68.3) |
No |
||||||
.171 |
10 (71.4) |
4 (28.6) |
12 (85.7) |
Acute |
Yes |
Chronic liver disease |
|
276 (95.2) |
No |
||||||
.334 |
7 (70.0) |
3 (30.0) |
1 (10.0) |
Brain |
Yes |
Cancer |
|
280 (96.6) |
No |
||||||
.036 |
138 (52.1) |
127 (47.9) |
265 (91.4) |
Yes |
Symptom to admission |
Clinical |
|
.805 |
4 (2-7) |
5 (2-7) |
5 (2-7) |
Symptom to admission interval (day) |
|||
.055 |
109 (54.0) |
93 (46.0) |
202 (69.7) |
Yes |
Dyspnea |
||
.093 |
21.62±8.09 |
20.06±7.71 |
20.84±7.93 |
RR (per minute) |
|||
.001 |
90 (85-93) |
93 (87.5-96) |
91 (86-95) |
SPO2 (%) |
|||
.990 |
6.7 (4.5-10.35) |
6.7 (4.75-10.75) |
6.7 (4.65-10.5) |
WBC (*109/L) |
Laboratory |
||
.000 |
13.59±4.70 |
11.09±4.71 |
12.34±4.86 (2-23) |
Semi-quantitative CT-ss |
Imaging |
||
.449 |
43 (46.7) |
49 (53.3) |
41 (14.1) |
Minimal |
Yes |
Pleural effusion |
|
198 (68.3) |
No |
||||||
.122 |
0 |
4 (100) |
4 (1.4) |
Yes |
Intubation |
|
|
.000 |
85 (78.0) |
24 (22.0) |
109 (37.6) |
Yes |
Ventilation |
||
.037 |
135 (52.1) |
124 (47.9) |
259 (89.3) |
Yes |
O2 therapy |
Outcome |
|
.246 |
38 (44.7) |
47 (55.3) |
85 (29.3) |
Yes |
Chronic GC use |
||
.772 |
10 (5-16) |
9 (6-14) |
9 (5.75-15) |
Hospital length of stay (day) |
|||
The results in Table 1 show that deceased patients’ mean age (68.20 16 16.07) was significantly higher than that of surviving patients (54.72 19 19.50) (p<0.001). Also, the presence of diabetes, hypertension and CKD was significantly correlated with a higher mortality rate in COVID-19 patients (62.2% mortality rate in diabetic patients versus 41.7% in non-diabetics, 58.7% mortality rate in hypertensive patients versus 42.1% in normotensive patients, and 80.4% mortality rate in patients with CKD versus 35.9% in patients without CKD). The presence of symptoms before admission was significantly associated with higher mortality rates, as 52.1% of patients who were symptomatic pre-admission died in hospital, while the mortality rate in patients who were symptom-free before admission was only 28% (p = 0.036). The mean air-room SPO2 level on the first day of admission in deceased patients (90%) was significantly lower than that of survived subgroup (93%) (p = 0.001). The mean value of lymphocyte count, NLR, ESR, CRP, LDH, BS, BUN, and Cr in the deceased subgroup were significantly higher than those of survived subgroup (p <0.05). Moreover, the mean CT-ss in deceased patients was significantly higher than that of survived patients (p <0.001). Finally, the need for respiratory supportive therapy (O2 therapy via nasal cannula and mechanical ventilation) was meaningfully associated with a higher mortality rate (52.1% mortality in patients undergoing O2 therapy versus 32.3% in patients not receiving O2 therapy; and 78% mortality in patients requiring mechanical ventilation versus 33.1% in patients who did not undergo mechanical ventilation).
A logistic regression model was implemented to model the relationship between the aforementioned variables and in-hospital mortality rate, the results of which are presented in Table 2. It should be noted that only variables with p-values of less than 0.25 were incorporated into the multiple logistic regression model (namely gender, age, DM, HTN, CKD, Liver disease, symptom to admission time interval, dyspnea, respiratory rate, SPO2 , lymphocyte count, NLR, ESR, CRP, LDH, CPK, AST, ALT, BS, BUN, Cr, CT-ss, receiving nasal O2 therapy, undergoing mechanical ventilation, long-term glucocorticoid therapy).
Table 2
In table 2, only significant variables (with a p-value of <0.05) are tabulated.
According to Omnibus test results, the model fit is acceptable, and at an error level of less than 0.001, the model is significant. Additionally, the value of the coefficient of determination (Pseudo R-square) shows that 26 variables considered were able to explain alterations in patient mortality rate in 40.8 to 54.4% of the case. Moreover, according to the values of parent statistics and p-values, it can be concluded that among the 26 variables considered, only 5 variables (age, CKD, CT-ss, ventilation, and long-term glucocorticoid therapy) have a significant relationship with the mortality rate in COVID-19 patients. According to OR values, one year of increase in age increases the chance of death by 1.041 times, and an increase in the CT-ss by one unit increases the chance of death by 1.099 times. Mortality rate in CKD patients is 4.3 times higher than that of patients without CKD, and in patients who required ventilation is 10.4 times of that of patients who did not require ventilation. Lastly, the mortality rate among patients who are not under corticosteroid therapy is 3.08 times (1÷0.324) of that of patients who receive corticosteroids.
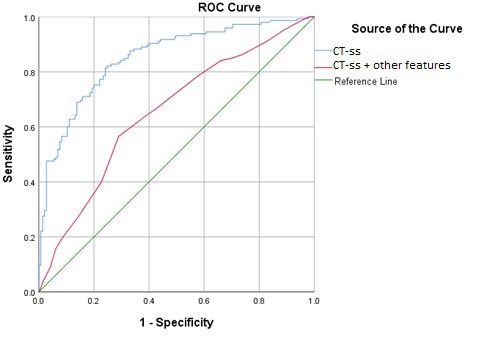
Eventually, the ROC curves (Table 3) were plotted to test the predictive value of the CT-ss as a single factor and to define a properly discriminating cut-off value.
Table 3
The results of Table 3 show that CT-ss alone can predict mortality with a cut-off point of 12.5 with an average power (area under the curve (AUC) of 0.653); however, when combined with other model predictors, predictive power increases by nearly 20% (0.852).
Conclusion
In conclusion, our study founds semi-quantitative CT severity score as an easy to calculate and meaningfully predictive of mortality in patients with COVID-19 pneumonia. We hope this can help medical staff to triage and risk-stratify COVID-19 to pick out patients who are in need of more aggressive treatment and more intense care and to follow the therapy response in them. However, larger-scale studies and investigations with longer follow-up periods are needed to further validate the predictive value of semiquantitative CT severity score and to incorporate it into other clinicolaboratory tests for better resources allocation in this era of human/technical resource shortage.
Declaration of competitive interest: The authors state that there is no conflict of interest. The study did not receive any specific funding from public, commercial, or nonprofit funding agencies.
References
- Commission WMH. Wuhan Municipal Health Commission’s Briefing on the Pneumonia Epidemic Situation. 2020.
- WHO. Coronavirus [Available from: https://www.Who.Int/zh/ emergencies/diseases/novel-coronavirus-2019.
- Worldometer. COVID-19 Coronavirus Pandemic [Available from: https://www.worldometers.info/coronavirus/.
- Zhou S, Wang Y, Zhu T, Xia L. CT features of coronavirus disease 2019 (COVID-19) pneumonia in 62 patients in Wuhan, China. American Journal of Roentgenology. 2020; 214: 1287-1294.
- Xiong Y, Sun D, Liu Y, Fan Y, Zhao L, Li X, et al. Clinical and highresolution CT features of the COVID-19 infection: Comparison of the initial and follow-up changes. Investigative radiology. 2020.
- Chen N, Zhou M, Dong X, Qu J, Gong F, Han Y, et al. Epidemiological and clinical characteristics of 99 cases of 2019 novel coronavirus pneumonia in Wuhan, China: a descriptive study. The lancet. 2020; 395: 507-513.
- Huang C, Wang Y, Li X, Ren L, Zhao J, Hu Y, et al. Clinical features of patients infected with 2019 novel coronavirus in Wuhan, China. The lancet. 2020; 395: 497-506.
- Wang D, Hu B, Hu C, Zhu F, Liu X, Zhang J, et al. Clinical characteristics of 138 hospitalized patients with 2019 novel coronavirus–infected pneumonia in Wuhan, China. Jama. 2020; 323: 1061-1069.
- Rawat U, Cohen SL, Levsky JM, Haramati LB. ACR white paper– based comprehensive dose reduction initiative is associated with a reversal of the upward trend in radiation dose for chest CT. Journal of the American College of Radiology. 2015; 12: 1251-1256
- Azadbakht J, Khoramian D, Lajevardi ZS, Elikaii F, Aflatoonian AH, Farhood B, et al. A review on chest CT scanning parameters implemented in COVID-19 patients: Bringing low-dose CT protocols into play. Egyptian Journal of Radiology and Nuclear Medicine. 2021; 52: 1-10.
- Chang Y-C, Yu C-J, Chang S-C, Galvin JR, Liu H-M, Hsiao C-H, et al. Pulmonary sequelae in convalescent patients after severe acute respiratory syndrome: Evaluation with thin-section CT. Radiology. 2005; 236: 1067-1075.
- Pan F, Ye T, Sun P, Gui S, Liang B, Li L, et al. Time course of lung changes on chest CT during recovery from 2019 novel coronavirus (COVID-19) pneumonia. Radiology. 2020.
- Yuan M, Yin W, Tao Z, Tan W, Hu Y. Association of radiologic findings with mortality of patients infected with 2019 novel coronavirus in Wuhan, China. PloS one. 2020; 15: e0230548.
- Li K, Wu J, Wu F, Guo D, Chen L, Fang Z, et al. The clinical and chest CT features associated with severe and critical COVID-19 pneumonia. Investigative radiology. 2020.
- Lyu P, Liu X, Zhang R, Shi L, Gao J. The performance of chest CT in evaluating the clinical severity of COVID-19 pneumonia: Identifying critical cases based on CT characteristics. Investigative radiology. 2020; 55: 412-421.
- Kazemi MA, Ghanaati H, Moradi B, Chavoshi M, Hashemi H, Hemmati S, et al. Prognostic factors of initial chest ct findings for icu admission and mortality in patients with covid-19 pneumonia. Iranian Journal of Radiology. 2020; 17.
- Abbasi B, Akhavan R, Khameneh AG, Zandi B, Farrokh D, Rad MP, et al. Evaluation of the relationship between inpatient COVID-19 mortality and chest CT severity score. The American Journal of Emergency Medicine. 2021; 45: 458-463.