
Journal of Clinical Images and Medical Case Reports
ISSN 2766-7820
Research Article - Open Access, Volume 3
Predicting grade of esophageal squamous carcinoma: Can stretched exponential model-based DWI perform better than bi-exponential and mono-exponential model?
Hui Yang1; Xubo Ge2; Xiuzhu Zheng1; Xiaoqian Li1; Jiang Li1; Min Liu1; Jianzhong Zhu1; Jian Qin1*
1 Department of Radiology, The Second Affiliated Hospital of Shandong First Medical University, Tai’an 271000, Shandong, China.
2 Department of Radiology, The Fourth People’s Hospital of Taian, Tai’an 271000, Shandong, China.
*Corresponding Author: Jian Qin
Department of Radiology, The Second Affiliated
Hospital of Shandong First Medical University, No.
366 Taishan Street, Tai’an City, Shandong Province,
China.
Email: sdqinjian@126.com
Received : Feb 26, 2022
Accepted : Mar 21, 2022
Published : Mar 28, 2022
Archived : www.jcimcr.org
Copyright : © Qin J (2022).
Abstract
Background: To evaluate and compare the potential performance of various diffusion parameters obtained from Mono-Exponential Model (MEM), Bi-Exponential Model (BEM), and Stretched Exponential Model (SEM) Diffusion-Weighted Imaging (DWI) models in grading of Esophageal Squamous Carcinoma (ESC).
Methods: Eighty-two patients with pathologically confirmed ESC without treatment underwent multi-b-value DWI scan with 13 b values (0~1200 s/mm2 ). The Apparent Diffusion Coefficient (ADC) deriving from the MEM; The Pure Molecular Diffusion (ADCslow), Pseudo-Diffusion Coefficient (ADCfast), Perfusion And Fraction (f) deriving from the BEM; the Distributed Diffusion Coefficient (DDC) and water molecular diffusion heterogeneity index (α) deriving from the SEM obtained were calculated and compared between poorly differentiated and well / moderately differentiated ESC respectively. The prediction parameters and diagnostic efficiency were compared by drawing Receiver Operating Characteristic (ROC) curve.
Results: ADC, ADCslow, ADCfast, DDC in poorly ESC were significantly lower than those in well/moderately differentiated ones. By using only one parameter, ADCslow, DDC had the moderate diagnostic efficiency and the Areas Under the Curve (AUC) were 0.758 and 0.813 in grading ESC. DDC had the maximum AUC with sensitivity (88.00%) and specificity (68.42%). Combining ADC with ADCfast, ADCslow, DDC and combining ADCslow with ADCfast can provide a higher diagnostic accuracy with AUC ranging from 0.756, 0.771, 0.816 and 0.793 respectively.
Conclusion: Various parameters derived from different DWI models including MEM, BEM and SEM, are potentially helpful in grading ESC. Compared with MEM model, ADCslow and DDC have better diagnostic performances. DDC obtained from SEM based model is the most promising diffusion parameter for predicting the grade of ESC.
Keywords: Esophageal carcinoma; Diffusion magnetic resonance imaging; Stretched exponential model; Intravoxel incoherent motion.
Abbreviations: MEM: Mono-Exponential Model; BEM: Bi-Exponential Model; SEM: Stretched Exponential Model; DWI: Diffusion-Weighted Imaging; ESC: Esophageal Squamous Carcinoma; ADC: Apparent Diffusion Coefficient; ADCslow: Pure Molecular Diffusion; ADCfast: Pseudo-Diffusion Coefficient; DDC: Distributed Diffusion Coefficient; ROC: Receiver Operating Characteristic; IVIM: Intravoxel Incoherent Motion; ROI: Region Of Interest; TR/ TE: Repetition Time / Echo Time; NEXs: Number Of Excitations; AUC: Area Under the Curve; SNR: Signal-to-Noise Ratio.
Citation: Yang H, Ge X, Zheng X, Li X, Qin J, et al. Predicting grade of esophageal squamous carcinoma: Can stretched exponential model-based DWI perform better than bi-exponential and mono-exponential model?. J Clin Images Med Case Rep. 2022; 3(3): 1762.
Introduction
Esophageal Squamous Carcinoma (ESC) is one of the leading reasons of cancer-related mortality with a 5-year survival rate between 15-20% [1]. Preoperative staging and pathological grading represent important prognostic indicators and determine different treatment because the tumors can be curatively resected before distant metastasis or adjacent structure invasion arise [2]. However, accurate preoperative grading of esophageal carcinoma has been the challenge that conventional radiograph need to face, which can only reflect the morphological changes of ESC [2]. Endoscopic guided biopsy as a gold standard procedure is widely employed to diagnose esophageal carcinoma as early as possible, but it entails invasiveness, which cannot reflect the grade of the whole tumor and is sometimes limited by sampling errors by different observers [3]. MRI, with its excellent ability such as in characterizing diseased tissues, without using ionizing radiation, can provide excellent morphological and functional information for ESC [4].
DWI is a noninvasive functional image sequence in the field of MRI, which uses the movement of water molecules in tissues. The diffusion of water can be quantitatively described by the Apparent Diffusion Coefficient (ADC) [5]. The MEM, BEM and SEM based models are all based on standard DWI with varying underlying models and differential governing parameters. Applying multiple models based on DWI protocol, the perfusion information could be obtained without the need for intravenous contrast media, which is especially relevant with patients who cannot receive intravenous gadolinium-based contrast media because of severe allergies or compromised renal function. However, as we all know, ADC featured by a simple mono-exponential decay is obtained from diffusion images with a postulation that the water molecular diffusion is a random motion, which have misestimate the influence of the microcirculation of blood in capillaries and could not reflect the true water diffusion [6]. In fact, there are two main aspects that affect the measured diffusion signals in living tissues: One is the motion of water molecules and another is the perfusion of blood microcirculation with low b values less than 200 s/mm2 which may lead to inaccurate estimation of the diffusion. In 1986, Le Bihan et al. [7] by using multi-b-value DWI with a bi-exponential curve fitting firstly described a new imaging technique named Intravoxel Incoherent Motion (IVIM), which has been used to quantitatively assess the microscopic translational motionon MRI. And lately in 2003, Bennett et al. [8] initially introduced the stretched exponential model, which can assess diffusion and heterogeneity of living tissues, considering the heterogeneity of intravoxel diffusion rates and distributed diffusion effect in each voxel in multiple pools of water molecules and has been used in several clinical studies [9].
To our knowledge, BEM based DWI models have been used to evaluate the tumor stage and pathological differentiated grade of oesophageal cancer as well as predicting treatment response [10]. There is however a lack of research in the parameters of the SEM based model. Therefore, the purpose of this study is to investigate the ability and potential additional value of the SEM based model of DWI comparing with MEM, BME based models in differentiating the pathological grade of ESC.
Materials and methods
Patient population
This study was approved by the ethics committee of our hospital and informed consent was obtained from each patient. Eighty-six cases of patients with ESC in our hospital from January 2018 to November 2019 were collected in the present study. Inclusion criteria: (1) MRI plain scan and multi-b-value DWI performed in patients with suspicious ESC by barium study of gastrointestinal tract or CT examination, where the tumour was considered resectable. (2) Before the MRI scan, the patients were not treated with radiation therapy, chemotherapy nor biotherapy. The MRI images showed no artefacts, which could affect the diagnosis. (3) All the patients underwent surgical resection with ESC confirmed by operation and pathology ultimately. The exclusion criteria were as follows: (1) the quality of the MR images was poor. (2) the tumour was too small to draw the Region Of Interest (ROI). Finally, three patients with poor multi-b-value DWI scan and one patient with large necrosis of tumor were excluded.
Magnetic resonance imaging
MRI examinations were performed on a 3T scanner (Discovery 750, GE Healthcare) with an 8-channel phase array coil. The patients were in supine position. The scanning range was centered on the lesion of the esophagus, covering the esophageal cancer. The patients other words please slow breath training before the examination. The signal was acquired using respiratory gating free breathing for the patients with even breath.
Routine MRI was acquired with a Fast Spin Echo (FSE) sequence, with respiratory gating. Axial T2-weighted images were obtained with TR/TE of 9230/85 msec (effective), and the slice thickness was 8.0 mm with spacing of 0.5 mm; FOV, 40 × 40 cm2 ; acquisition matrix, 288 × 256; NEX, 2; the acquisition time was 3 min 14 s. Sagittal fat- saturation T2-weighted images were obtained with TR/TE of 10909/85 msec (effective), and the slice thickness was 6.0 mm with spacing of 0.5 mm; FOV, 40 × 40 cm2 ; acquisition matrix, 288 × 256; NEX, 2; the acquisition time was 3 min 49 s. IVIM images were acquired via echo-planer imaging in the axial plane. Parallel imaging was used with the following sequence parameters: Repetition Time / Echo Time (TR/ TE), 4500/85 msec; Field Of View (FOV), 24 ×24 cm2 ; acquisition matrix, 128 × 128; slice thickness, 6.0 mm; spacing, 0.5 mm. 13 b values from 0–1200 sec/mm2 (0,10, 20, 50, 80, 100, 150, 200, 400, 600, 800, 1000, 1200) were used in three diffusion directions, and the Number Of Excitations (NEXs) for each b was 2, 2, 2, 2, 2, 2, 2, 2, 2, 4, 6, 8, 10. The acquisition time was 10 min 3 s. In addition, the axial and sagittal T2 weighted fat-suppressed images were performed for the localization of ESCso as to plan the multi-b-value DWI scans of tumor.
Data analysis
DWI original image was processed using the Advantage Workstation (ADW 4.6 version, GE, US) and post-processed by Functool workstation to obtain ADC map. All MRI examinations were independently processed by two radiologists with 15 years and 10 years of experience in reading MR images. They evaluated the multi-b-value DWI data, and were blinded to histopathological results. The Region Of Interest (ROI) was placed to cover as much of the solid part of the tumors as possible on three consecutive maximal slices of the oesophageal tumour in the axial plane, avoiding areas of oesophageal lumen. All parameters were measured twice of each three representative slices, and their average values were calculated for future statistical analysis to reduce the effect of different ROI delineation and measurement by different observers.
Histopathological examinations
All resected specimen were examined by pathological examination. The interval between MRI examination and last surgery was less than 10 days, and these patients did not receive any treatment during the interval. According to the seventh edition of American Joint Committee on Cancer Stage (AJCC,7th) [11], the pathologically differentiated grade of ESC was categorized into poorly differentiated, moderately differentiated and well differentiated carcinoma respectively.
Statistical analysis
The IBMSPSS Statistics 23 software (Armonk, NY) and MedCalc 15.8 (Mariakerke, Belgium) were used for statistical analysis. Quantitative parameters are expressed as the means ± standard deviation. Data were tested for normality analysis using the Kolmogorov–Smirnov test and then with the Levene test for variance homogeneity analysis. Independent t test or Mann-Whitney U test were used to compare the difference of each parameter between poorly differentiated group and well/ moderately differentiated groups. In order to evaluate interobserver variability, the interobserver agreement was evaluated using ICC and Bland-Altman analysis. Values of the first set of measurement were regarded as the parameters for the tumors when the ICC was more than 0.75 [12]. When the ICC was less than 0.75, an average of different measurements of two reviewers was used as the final result for the subsequent analysis. Receiver Operating Characteristics (ROC) curves analyses were performed to evaluate the diagnostic performance of each DWI parameter in distinguishing the poorly differentiated group from the well/moderately differentiated groups and the sensitivity and specificity of these parameters were calculated also. The Area Under the Curve (AUC) of ROC curve for the significant parameters was calculated and compared by Med Calc. P values of less than 0.05 were considered as statistically significant.
Results
Patients and histology results
82 cases of patients with ESC were enrolled in this study, including 49 males and 33 females (age range 42-77 years, median age 54 years). There were 12 well differentiated ESC, 31 moderately differentiated ESC, 14 mix well/moderately differentiated ESC and 25 poorly differentiated ESC by histopathological examinations, with 7 tumors located in the upper-esophagus and 35 tumors in the middle-esophagus, 40 tumors in the lower-esophagus.
Interobserver agreements of parameters’ measurements derived from different DWI models
The ICC values (Table 1) were 0.799 for ADC, 0.804 for ADCslow, 0.840 for ADCfast, 0.893 for f, 0.882 for DDC and 0.766 for α. The Bland-Altman plots representing the interobserver reproducibility between the two readers are shown in Figure 1. The centre solid line represents the mean of differences.
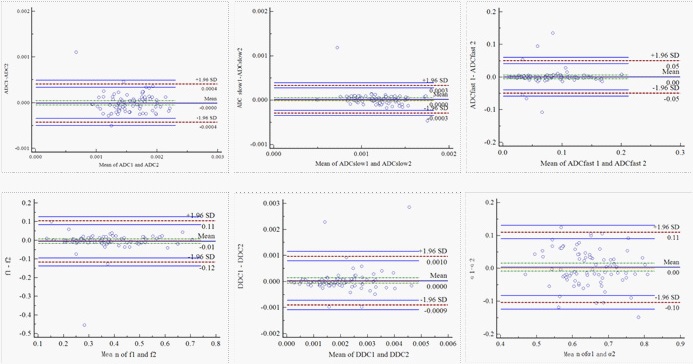
Table 1: Interobserver Reproducibility in the Assessment of Different DWI Parameters.
Parameter |
Interclass coefficient correlation |
95% confidence interval |
0.799 |
0.705-0.866 |
|
ADCslow |
0.804 |
0.713-0.869 |
ADCfast |
0.840 |
0.763-0.894 |
f |
0.893 |
0.854-0.936 |
DDC |
0.882 |
0.823-0.922 |
α |
0.766 |
0.659-0.844 |
ADC: The Apparent Diffusion Coefficient; ADCslow: Pure Molecular Diffusion; ADCfast: Pseudo-Diffusion Coefficient; DDC: Distributed Diffusion Coefficient; f: Fraction; α: Water Molecular Diffusion Heterogeneity Index.
Comparisons of the parameters derived from various quantitative DWI models
The ADC, ADCslow, ADCfast, f, DDC and α from different pathological differentiated grade of ESC derived from various DWI models were shown in Table 2 (Figure 2, Figure 3). The results showed that ADC, ADCslow, ADCfast, DDC in poorly differentiated group were significantly lower than those in well/moderately differentiated groups (Table 2). However, there was no significant difference about f and α value (z=-0.574, P=0.566 for f, t=0.140, P=0.889 for α) (Table 2).
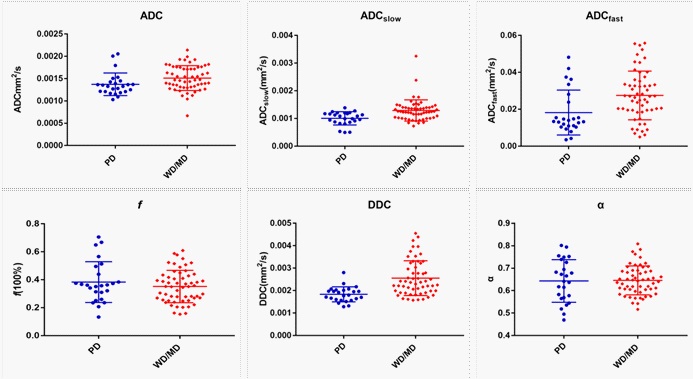
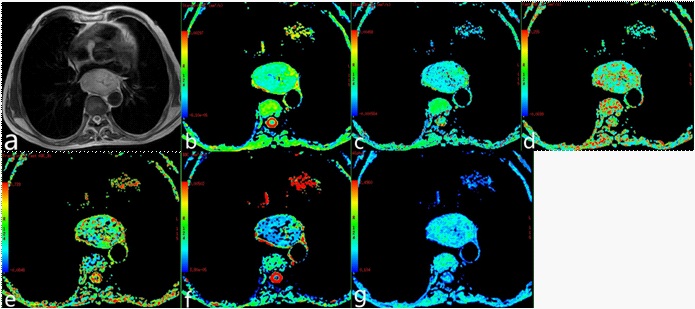
Table 2: Comparison between Poorly and Well/Moderately Differentiated Groups about Different Parameters.
|
Poorly differentiated group |
well/moderately differentiated groups |
t/z |
P |
ADC(×10-3 mm2/s) |
1.372±0.252 |
1.512±0.277 |
2.149a |
0.035 |
1.004±0.240 |
1.287±0.384 |
-3.702b |
0.000 |
|
ADCfast(×10-3 mm2/s) |
18.197±12.168 |
27.474±13.212 |
-2.936b |
0.003 |
f |
0.383±0.145 |
0.351±0.115 |
-0.574b |
0.566 |
DDC(×10- 3mm2/s) |
1.829±0.334 |
2.550±0.776 |
-4.493b |
0.000 |
α |
0.642±0.094 |
0.645±0.064 |
0.140a |
0.889 |
U test ADC: The Apparent Diffusion Coefficient; ADCslow: Pure Molecular Diffusion; ADCfast: Pseudo-Diffusion Coefficient; DDC: Distributed Diffusion Coefficient; f = Fraction; α: Water Molecular Diffusion Heterogeneity Index. Heterogeneity Index.
Diagnostic performance of various quantitative DWI models
Based on the previous results of Independent t test and Mann-Whitney U test for comparisons, we performed ROC analysis of the different DWI-derived parameters with significant difference for distinguishing the poorly differently group from well/moderately groups as showing in Figure 4. The maximum Youden index, AUC, sensitivity and specificity are illustrated in Table 3. By using only one parameter, the ADCslow, DDC had the moderate diagnostic efficiency and the areas under the curve were 0.758 and 0.813 respectively. The ROC curves shown DDC had the maximum AUC with sensitivity (88.00%) and specificity (68.42 %), ADC had the minimum AUC. The AUC of DDC was higher than that of ADC, ADCslow and ADCfast, but showed no statistical difference (P=0.110, 0.331 and 0.226). The ADC, ADCslow, DDC demonstrated the highest sensitivity (88%), but DDC had higher specificity(68.42%);ADCfast demonstrated the highest specificity with 80.70%. Combining ADC with ADCfast, ADCslow, DDC and ADCslow with ADCfast can provide a higher diagnostic accuracy with areas under the curve ranging from 0.756 to 0.816 (Table 3).
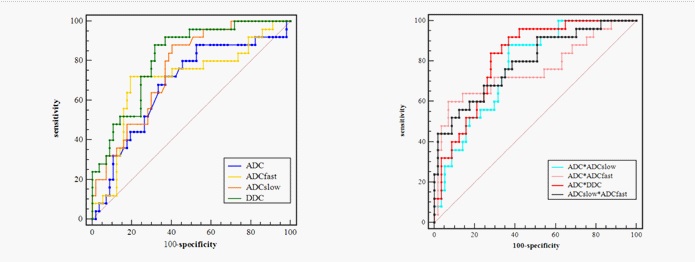
Table 3: ROC related Parameters in differentiating the Poorly and Well/Moderately Differentiated Groups Groups of ESC.
Parameters |
Maximum Youden index |
Area under the curve |
Sensitivity (%) |
Specificity (%) |
ADC |
0.354 |
0.680 |
88.00 |
47.37 |
ADCslow |
0.476 |
0.758 |
88.00 |
59.65 |
ADCfast |
0.527 |
0.705 |
70.20 |
80.70 |
DDC |
0.564 |
0.813 |
88.00 |
68.42 |
ADC*ADCfast |
0.529 |
0.756 |
60.00 |
92.98 |
ADC*ADCslow |
0.511 |
0.771 |
88.00 |
63.16 |
ADC*DDC |
0.559 |
0.816 |
84.00 |
71.93 |
ADCslow*ADCfast |
0.437 |
0.793 |
56.00 |
87.72 |
ADC: The apparent diffusion coefficient; ADCslow: pure molecular diffusion; ADCfast: pseudo-diffusion coefficient; DDC: Distributed Diffusion Coefficient; f: fraction; α: Water Molecular Diffusion
Discussion
MRI scans are increasingly used in the staging of gastrointestinal tumors because of their good soft tissue resolution. Applying multiple models based on DWI protocol, the perfusion information could be obtained without the need for intravenous contrast media. The main study of DWI currently conducted in ESC is to improve tumor’s early detection, staging accuracy and predict treatment efficacy [13-16]. Therefore, the purpose of this study is to investigate the ability and potential additional value of the SEM based model of DWI comparing with MEM, BEM based models in differentiating the pathologically grade of ESC.
In our present study, the results demonstrated that ADC values were significantly lower in poorly differentiated tumors than in well/moderately ones, showing that ADC decreased with decreasing of pathological differentiation, which was consisted with the results of Zhu et al [10], who also demonstrated that both ADC and ADCslow aided in assessing tumor cell grade, and the numeric values of the poorly-differentiated esophageal carcinoma was lower than the moderately-differentiated and well-differentiated groups. Histologically, the decreased value of ADC in poorly differentiated ESC may be related to the following reasons: The fast proliferation of malignant tumor cell, the increase of cell density, the shrinking of extracellular space, and the increase of the nucleo-cytoplasmic ratio. Huang et al [17] also found that ADC decreased with T-stage of ESC and Aoyagi et al [18] found that ADC of advanced-stage tumors were significantly lower than that of early-stage tumors. Sakurada A et al [13] reported that combining T2WI and DWI had obtained detection rates in T-staging of ESC, they were 33% for T1, 58% for T2, 96% for T3 and 100% for T4, respectively. Kiyohiko Shuto et al [15] reported that the clinical impact of DWI showed higher sensitivity than PET in predicting postoperative survival for patients with ESC. But ADC values are quantified by measuring mean diffusivity along three orthogonal directions, which are mainly influenced by not only cellularity, but also microcirculation. Cellularity and microcirculation would influence ADC measurements in a diametrically opposite direction [19]. However, IVIM can assess the microscopic motion, diffusion and heterogeneity of living tissues, considering the heterogeneity of intravoxel diffusion rates and distributed diffusion effect in each voxel in multiple pools of water molecules.
There are few studies on the evaluation of esophageal carcinoma by IVIM-DWI model. Lei Jet al [20] studied the application value of IVIM-DWI in the diagnosis of early esophageal cancer, showed that f value could differentiate between esophageal carcinoma and normal esophagus. Huang et al [17] found that IVIM-DWI derived parameter D (Pure diffusion coefficient), f negatively correlated with the stage of ESC and D could distinguish T1-staged tumour from normal oesophageal wall in detail, which might be probably related to the smooth muscle proliferation and extracellular stroma expansion that blocks the free water diffusion in the progress of ESC. Zhenget al [21] showed that ADC, D and f increased significantly during concurrent Chemoradiotherapy (CRT), proved that IVIM-DWI parameters combining with ADC were useful at an early stage of treatment and assessment of prognosis. Zhu et al [10] used IVIM and conventional DWI parameters to evaluate the pathologically differentiated grade of esophageal carcinoma, showed that the ADCslow and ADC had a significantly higher diagnostic performance than ADCfast and f.
As shown in our study, the ADCslow values representing the pure diffusion were lower than ADC values and the AUC value of the ADCslow were higher than ADC in distinguishing poorly from well/moderately differentiating ESC, this were because BEM based DWI model can separate the diffusion and perfusion component from overall DWI measurements. ADCslow values obtained from this model can supply precise differential diagnosis and reduced the bias by avoiding microcirculation contributions [22]. The ADCslow deriving from the BEM based DWI model can eliminate the interference of perfusion and maintain the true diffusion, suggesting that ADCslow has a higher diagnostic performance than ADC. It is noted that despite the better diagnostic performance of ADCslow but a low value of specificity was present in differentiating poorly from well/moderately differentiated lesions. This may be related to the pathological heterogeneity of tumors and overlapping grade of differentiated ESC from the point of the pathology. At the same time, the stability of the parameters in MRI may be affected by the surrounding structure such as bone and air.
ADCfast values represent a perfusion-related coefficient and reflect microcirculation [22]. Our data demonstrated that the perfusion parameters ADCfast was statistically significant in differentiating the poorly and well/moderately differentiated lesions, but f values showed no statistical difference, which only a gradually increasing trend from the well/moderately to poorly differentiated lesions, inconsistent with the research of Zhu et al [10]. However, there are different conclusions for ADCfast in distinguishing the behavior of the tumors in other systems [23,24]. ADCfast was considered proportional to average blood velocity and capillary segment length [7]. The result may be by reason of the different anatomical blood supply of esophageal segments and inconsistent of capillary length in different grade of ESC. Furthermore, because of the low Signal-to-Noise Ratio (SNR) and the limited small b value range of measurements available, the values of ADCfast may not be reliable and needs to be further studied.
SEM based DWI model is an alternate method that may quantify both tissue heterogeneity and diffusion simultaneously, which was more reliable and reproducible than the MEM and BEM based DWI models particularly in prior studies [25,26]. The results of our study showed that utilizing the DDC value of poorly lesions was significantly lower than that of well/moderately differentiated ones, and the ROC curves showed DDC had the maximum AUC that demonstrated excellent diagnostic performance in differentiating poorly from well/moderately differentiated lesions. The DDC can be considered to be the weighted sum of continuous distribution of ADCs, which can represent multiexponential attenuation and thus provide a more accurate and reliable depiction of tissue diffusion [26,27]. Our result may be explained by increasing mitotic activity, necrosis, nuclear atypia, nucleus to cytoplasm ratio and small cells with increased intracellular complex protein molecules, leading to more intravoxel diffusion heterogeneity. However, in our study, the α value was slightly lower in poorly differentiated lesions, but showed no statistical difference in the present study. The α value described the deviation of water diffusion from a single exponential decay and is supposed to relate to intravoxel water diffusion heterogeneity, which indicates a numerically low α index (α near 0) represents a high degree of diffusion heterogeneity exhibited as multi-exponential decay, while a numerically high α index (α near 1) represents low intravoxel diffusion heterogeneity approaching monoexponential decay. Our result consistent with the current study, Lin et al [28] did not find a difference between high-grade and low-grade meningiomas and Wang et al [29] demonstrated that α was not significantly different in the various stage and grade bladder cancers. Former research indicated that α value can be used to differentiate high-grade and low-grade gliomas with AUC of 0.892 [30]. It is related to the intravoxel water molecular diffusion heterogeneity and the differences of results suggested that α varied among different types of tumours, which need further larger cohort studies.
Additionally, the results of the ROC used to distinguish from poorly than well/moderately differentiated lesions. By using only one parameter, DDC had the maximum AUC with sensitivity (88.00%) and specificity (68.42%), suggesting that it is a reliable diagnostic markers compared with other parameters. Combining ADC with ADCfast, ADCslow, DDC and combining ADCslow with ADCfast can provide a higher diagnostic accuracy with areas under the curve ranging from 0.756 to 0.816. Therefore, the combination of multiple parameters of different DWI models may have a more powerful diagnostic value.
Limitatons
This study still has several limitations. Firstly, the sample size of poorly differentiated ESC was relatively small and further prospective analyses of a larger number of patients will be needed to validate present results. Secondly, the ROIs were placed to cover as much of the solid part of the tumors as possible on three consecutive maximal slices of the oesophageal tumour, which might lead to bias owing to tumour heterogeneity, and did not contain the entire volume. Therefore, entire tumours should be measured in future research.
Conclusions
In conclusion, various parameters derived from different DWI models including MEM, BEM and SEM, are potentially helpful in grading ESC. Compared with MEM based model, ADCslow and DDC have better diagnostic performances. DDC obtained from SEM based model is the most promising diffusion parameter for predicting the grade of ESC.
Declarations
Acknowledgements: The present study was supported by grants from the Academic promotion programme of Shandong First Medical University (No. 2019QL017).
Statement of ethics: The questionnaire and methodology for this study was approved by the Human Research Ethics committee of The Second Affiliated Hospital of Shandong First Medical University (No. 201712057). Informed consent was obtained from all individual participants included in the study.
Conflict of interest statement: Not applicable.
Funding source: The present study was supported by grants from the Academic promotion programme of Shandong First Medical University (No. 2019QL017).
Author contributions: Hui Yang: Conceptualization, WritingOriginal draft preparation. Xubo Ge: Conceptualization, Methodology. XiuzhuZheng: Visualization, Software. Xiaoqian Li: Data curation, Formal analysis. Jiang Li: Data curation, Methodology. Min Liu: Formal analysis, Visualization, Resources. Jianzhong Zhu: Supervision, Project administration. Jian Qin: Supervision, Resources, Writing- Reviewing and Editing
Data availability statement: The data sets generated during the current study are not publicly available due our research is still ongoing, but they are available from the corresponding author on reasonable request.
References
- Gupta B, Kumar N. Worldwide incidence, mortality and time trends for cancer of the oesophagus. Eur J Cancer Prev. 2017; 26: 107-108.
- Rice TW, Gress DM, Patil DT, Hofstetter WL, Kelsen DP, Blackstone EH, et al. Cancer of the esophagus and esophagogastric junction—major changes in the American Joint Committee on Cancer eighth edition cancer staging manual. CA Cancer J Clin. 2017; 67: 304-317.
- Swager A, Curvers WL, Bergman JJ. Diagnosis by endoscopy and advanced imaging. Best Pract Res Clin Gastroenterol. 2015; 29: 97-111.
- Tirumani H, Rosenthal MH, Tirumani SH, Shinagare AB, Krajewski KM, et al. Esophageal carcinoma: Current concepts in the role of imaging in staging and management. Can Assoc Radiol J. 2015; 66: 130-139.
- White NS, McDonald CR, Farid N, Kuperman J, Karow D, et al. Diffusion-weighted imaging in cancer: Physical foundations and applications of restriction spectrum imaging. Cancer Res. 2014; 74: 4638-4652.
- Fujima N, Sakashita T, Homma A, Shimizu Y, Yoshida A, et al. Advanced diffusion models in head and neck squamous cell carcinoma patients: Goodness of fit, relationships among diffusion parameters and comparison with dynamic contrast-enhanced perfusion. Magn Reson Imaging. 2017; 36: 16-23.
- Le Bihan D, Breton E, Lallem and D, Grenier P, Cabanis E, LavalJeantet M, et al. MR imaging of intravoxel incoherent motions: application to diffusion and perfusion in neurologic disorders. Radiology. 1986; 161: 401-407.
- Bennett KM, Schmainda KM, Bennett R, Rowe DB, Lu H, Hyde JS, et al. Characterization of continuously distributed cortical water diffusion rates with a stretched exponential model. Magn Reson Med. 2003; 50: 727-734.
- Seo N, Chung YE, Park YN, Kim E, Hwang J, Kim MJ, et al. Liver fibrosis: stretched exponential model out performs mono-exponential and bi-exponential models of diffusion-weighted MRI. Eur Radiol. 2018; 28: 2812-2822.
- Zhu S, Wei Y, Gao F, Li L, Liu Y, et al. Esophageal carcinoma: Intravoxel incoherent motion diffusion weighted MRI parameters and histopathological correlations. J Magn Reson Imaging. 2019; 49: 253-261.
- Rice TW, Rusch VW, Ishwaran H, Blackstone EH. Cancer of the esophagus and esophagogastric junction: data-driven staging for the seventh edition of the American
- Koo TK, Li MY. A guideline of selecting and reporting intraclass correlation coefficients for reliability research. J Chiropr Med. 2016; 15: 155-163.
- Joint Committee on Cancer/International Union Against Cancer Cancer Staging Manuals. Cancer. 2010; 116: 3763-3773.
- Sakurada A, Takahara T, Kwee TC, Yamashita T, Nasu S, Horie T, et al. Diagnostic performance of diffusion-weighted magnetic resonance imaging in esophageal cancer. Eur Radiol. 2009; 19: 1461-1469.
- Borggreve AS, Heethuis SE, Boekhoff MR, Goense L, van Rossum PSN, Brosens LAA, et al. Optimal timing for prediction of pathologic complete response to neoadjuvant chemoradiotherapy with diffusion-weighted MRI in patients with esophageal cancer. Eur Radiol. 2020; 30: 1896-1907.
- Shuto K, Kono T, Shiratori T, Akutsu Y, Uesato M, et al. Diagnostic performance of diffusion-weighted magnetic resonance imaging in assessing lymph node metastasis of esophageal cancer compared with PET. Esophagus. 2020; 7: 239-249.
- Cheng B, Yu J. Predictive value of diffusion-weighted MR imaging in early response to chemoradiotherapy of esophageal cancer: A meta-analysis. Dis Esophagus. 2019; 32: doy065.
- Huang YC, Chen TW, Zhang XM, Zeng NL, Li R, Tang YL, et al. Intravoxel incoherent motion diffusion-weighted imaging of resectable oesophageal squamous cell carcinoma: Association with tumour stage. Br J Radiol. 2018; 91: 20170421.
- Aoyagi T, Shuto K, Okazumi S, Shimada H, Nabeya Y, Kazama T, et al. Evaluation of the clinical staging of esophageal cancer by using diffusion-weighted imaging. Exp Ther Med. 2010; 1: 847- 851.
- Liu C, Liang C, Liu Z, Zhang S, Huang B. Intravoxel Incoherent Motion (IVIM) in evaluation of breast lesions: comparison with conventional DWI. Eur J Radiol. 2013; 82: e782-e789.
- Lei J, Tian Y, Zhu SC, Han Q, Wei Y, Yang S, et al.Preliminary study of IVIM-DWI and DCE-MRI in early diagnosis of esophageal cancer. Eur Rev Med Pharmacol Sci. 2015; 19: 3345-3350.
- Zheng H, Ren W, Pan X, Zhang Q, Liu B, et al. Role of intravoxel incoherent motion MRI in early assessment of the response of esophageal squamous cell carcinoma to chemoradiotherapy: A pilot study. J Magn Reson Imaging. 2018; 48: 349-358.
- Lin M, Yu X, Chen Y, Ouyang H, Wu B, Zheng D, et al. Contribution of mono-exponential, bi-exponential and stretched exponential model-based diffusion-weighted MR imaging in the diagnosis and differentiation of uterine cervical carcinoma. Eur Radiol. 2017; 27: 2400-2410.
- De Robertis R, Cardobi N, Ortolani S, Tinazzi Martini P, Stemmer A, et al. Intravoxel incoherent motion diffusion-weighted MR imaging of solid pancreatic masses: Reliability and usefulness for characterization. Abdom Radiol (NY). 2019; 44: 131-139.
- Tan H, Chen J, Zhao YL, Liu JH, Zhang L, et al. Feasibility of intravoxel incoherent motion for differentiating benign and malignant thyroid nodules. Acad Radiol. 2019; 26: 147-153.
- Li H, Liang L, Li A, Hu Y, Hu D, et al. Monoexponential, biexponential, and stretched exponential diffusion-weighted imaging models: Quantitative biomarkers for differentiating renal clear cell carcinoma and minimal fat angiomyolipoma. J Magn Reson Imaging. 2017; 46: 240-247.
- Kim HC, Seo N, Chung YE, Park MS, Choi JY, Kim MJ. Characterization of focal liver lesions using the stretched exponential model: Comparison with monoexponential and biexponential diffusionweighted magnetic resonance imaging. Eur Radiol. 2019; 29: 5111-5120.
- Wang F, Wang Y, Zhou Y, Liu C, Xie L, Zhou Z, et al. Comparison between types I and II epithelial ovarian cancer using histogram analysis of monoexponential, biexponential, and stretchedexponential diffusion models. J Magn Reson Imaging. 2017; 46: 1797-1809.
- Lin L, Xue Y, Duan Q, Chen X, Chen H, Jiang R, et al. Grading meningiomas using mono-exponential, bi-exponential and stretched exponential model-based diffusion-weighted MR imaging. Clin Radiol. 2019; 74: 651.e15-23.
- Wang Y, Hu D, Yu H, Shen Y, Tang H, Kamel IR, et al. Comparison of the Diagnostic Value of Monoexponential, Biexponential, and Stretched Exponential Diffusion-weighted MRI in Differentiating Tumor Stage and Histological Grade of Bladder Cancer. Acad Radiol. 2019; 26: 239-246.
- Qu Y, Zhou L, Jiang J, Quan G, Wei X. Combination of threedimensional arterial spin labeling and stretched-exponential model in grading of gliomas. Medicine. 2019; 98: e16012.