
Journal of Clinical Images and Medical Case Reports
ISSN 2766-7820
Research Article - Open Access, Volume 3
Value of tibial and peroneal minimum F-wave latency ROC curves in diabetic polyneuropathy diagnosis
Hooman Mahmoudi1,2; Elahe Keshavarzi1; Zahra Salehi2; Sepehr Jahanshahi2; Reza Derakhshan3; Attiyeh Vassaghi1; Hamid Reza Farpour4,5*
1M.D., Physiatrist, Department of Physical Medicine and Rehabilitation, Shiraz University of Medical Sciences, Shiraz, Iran.
2Dr Mahmoudi’s Rehabilitation Center, Shiraz, Iran.
3Pediatric Department, Rafsanjan University of Medical Sciences, Rafsanjan, Iran.
4M.D., Physiatrist, Bone and Joint Diseases Research Center, Department of Physical Medicine and Rehabilitation, Shiraz University of Medical Sciences, Shiraz, Iran.
5Shiraz Geriatric Research Center, Shiraz University of Medical Sciences, Shiraz, Iran.
*Corresponding Author : Hamid Reza Farpour
Department of Physical Medicine and Rehabilitation, Faculty of Medicine, Shiraz University of Medical Science, Shiraz, Iran.
Tel: +98-917-117-9541; ORCID ID: 0000000188673928;
Email: farporh@gmail.com; farporh@sums.ac.ir
Received : Aug 20, 2022
Accepted : Sep 14, 2022
Published : Sep 21, 2022
Archived : www.jcimcr.org
Copyright : © Farpour HR (2022).
Abstract
Introduction: F wave is one of the most sensitive electrodiagnostic parameters to verify the diabetic neuropathy even in absent or mild clinical symptoms.
Methods: In our prospective study, we determined the best cut-off point measures of tibial and peroneal Minimal F-Waves Latency (MFL), in 100 diabetic patients using Receiver Operating Characteristic (ROC) curves. We calculated the diagnostic measures with and without the correction for height to reveal the effect of correction on sensitivity and specificity.
Results: The area under the ROC curve measured 0.916 mm2 (± 0.064, 95% confidential interval) for 48.80 millisecond (ms) cut-off value of Tibial nerve and 0.914 mm2 (±0.054, 95% confidential interval) for 48.15 ms Peroneal nerve MFL cut-off value. MFL, especially when corrected for the height, ROC curves, give us better diagnostic values than average + 2 Standard Deviation (SD) cut- off point to be used for screening purposes to verify the diabetic neuropathy.
Conclusions: Lower limb F wave latency, especially when corrected for the height could be used as a strong tool in screening and diagnosis of diabetic polyneuropathy. It is a low cost and non-invasive procedure which can be done within minutes. MFL ROC curves give us better cut-off values to be used for screening purposes or in daily practice than average + 2 SD cut-off points.
Keywords: Correction for height; Diabetes mellitus; Minimal f-wave Peripheral neuropathy; ROC curves.
Abbreviations: CMAPs: Compound Muscle Action Potentials; DP: Diabetic polyneuropathy; DM: Diabetes Mellitus; MFL: Minimum F wave Latency; SNAPs: Sensory Nerve Action Potentials.
Citation: Mahmoudi H, Keshavarzi E, Salehi Z, Jahanshahi S, Farpour HR, et al. Value of tibial and peronel minimum F-wave latency ROC curves in diabetic polyneuropathy diagnosis. J Clin Images Med Case Rep. 2022; 3(9): 2066.
Introduction
Diabetic Polyneuropathy (DP) is a common complication of Diabetes Mellitus (DM) which is diagnosed by symptoms, signs, clinical examination and nerve conduction studies. To confirm the diabetic polyneuropathy, especially in mild cases, at least two abnormal electrodiagnostic findings should be detected [1]. These findings mostly include decreased nerve conduction velocity, decreased compound motor and sensory action potential amplitude and prolonged Minimum F wave Latency (MFL) [2-4]. Researchers reported that F wave is one of the most sensitive and reproducible parameters to verify the diabetic neuropathy even in patients with absent or mild clinical symptoms of neuropathy and in newly diagnosed diabetes mellitus [5-12].
The F-wave is a late muscle response that results from the antidromic activation of one or a small number of motor neurons following electrical stimulation of a peripheral nerve [8]. Kimura et al. focused on use of the F-wave in the diagnosis of DP, because it allows assessment of the proximal nerve segment, which is not accessible by the conventional nerve conduction studies [13]. Some researchers suggested that the distal nerve segment is more dominantly damaged in DP [13-15], and for this reason, F-wave studies have been considered to be of limited value in patients with subclinical diabetic neuropathy [3]. On the other hand, it has been reported that MFL is a reliable parameter because of its low variability and reproducible characteristics when Compound Muscle Action Potentials (CMAPs) and Sensory Nerve Action Potentials (SNAPs) have low amplitudes or even when SNAPs are absent [6-8]. Nevertheless, the diagnostic accuracy of F-wave in comparison with other nerve conduction parameters has not been extensively studied yet [16,17]. We could not find any study reporting all the diagnostic accuracy measures of MFL in DP (including ROC curves).
In our study, we tried to determine the diagnostic accuracy measures of tibial and peroneal F-waves, in diabetic patients. Also, using ROC curves, we determined the best cut off points to maximize the sensitivity or specificity or to optimize the sensitivity and specificity for clinical use. An important issue in interpretation of MFL values in daily practice is correcting the results for patient’s height which is frequently ignored by clinicians when they try to diagnose DP. We calculated the diagnostic measures of tibial and peroneal MFLs with and without the correction for height to reveal the effect of correction on sensitivity and specificity.
Methods
Participants: We recruited patients with diabetes mellitus type 2 referring to diabetes clinic of a teaching hospital. The study was approved by the ethical committee of Rafsanjan University of Medical Sciences (grant number: 9/20/584) and the informed consent was written by all participants.
Selection criteria: The diagnosis of diabetes mellitus was already made by an internist using routine biochemical and haematological tests including blood sugar and glycosylated hemoglobin (HbA1c). Ninety eight patients who did not have any of the exclusion criteria referred to electrodiagnosis lab to measure the MFLs of the tibial and peroneal nerves (index test) by a physiatrist. After that the patients were referred to another physiatrist blinded to the results of the index test for evalua evaluation of possible DP. Exclusion criteria were age more than 65 or less than 15, history of radicular low back pain, or documented radiculopathy, history of any other polyneuropathy, mononeuropathy of tibial or peroneal nerves, or any other pathology in peripheral nerves affecting tibial or peroneal nerves, history of any systemic disease which can affect peripheral nerves, such as uremia and rheumatologic disorders, patients with severe obesity (body mass index >35) or those with edematous limbs, which could make recording or stimulation difficult during nerve conduction studies.
Sample Size Calculation: To calculate the sample size based on sensitivity, we used the following equilibrium [18].
n = (Z1-α/2) 2 ×Sn × (1-Sn)/(L2×P)
Where α is size of the critical region (1-α is the confidence level (0.95 in our study)), Z1-α/2 is standard normal deviate (1.96 in our study), Sn is sensitivity, L is absolute precision desired on either side of the sensitivity or specificity (our assumption is 0.08), and P is the prevalence of the diabetic neuropathy in tested population (diabetic patients) which is 54.3% based on a previous study [19]. As we could not find any diagnostic accuracy study measuring the sensitivity or specificity of the MFL in DP, we used our clinical judgement and assumed MFL sensitivity as 90% for the purpose of sample size calculation.
According to the above formula and assumptions, we entered 100 diabetic patients into the study.
Because this survey was a prospective study, the data collection planned before the index test and reference standard performed.
Study intervention: F wave measurements were done by a physiatrist using a Medelec synergy electromyography instrument (VIASYS Healthcare, Surrey, UK) for all the entered patients. The following standard procedure was used in order to determine the tibial and peroneal F-waves. We obtained the MFL of tibial and peroneal nerves from abductor hallucis and extensor digitorum brevis muscles respectively unilaterally after 10 consecutive supramaximal stimulations with the stimulation frequency of 1 Hz. (supramaximal intensity has been determined as intensity 30% more than the amount producing maximum CMAP amplitude in motor testing). Other instrument settings for acquiring F responses were sweep speed of 10 ms/div, sensitivity of 200 μV/div, high pass filter of 5 Hz, and low pass filter of 10000 Hz. Surface temperature of the foot was kept above 31 degrees centigrade during the whole study.
We considered the minimum F latencies more than average + 2SD as prolonged. To correct the MFLs for the height, we used the F latency to height ratio technique [20]. The cut-off point for corrected and uncorrected MFLs were derived from our previous study on normal population [20].
Screening for Diabetic Polyneuropathy (Standard Reference Test): We defined a patient as having distal symmetrical polyneuropathy when he/she had the highest ordinal likelihood based on the consensus case definition protocol of American Association of Neuromuscular and Electrodiagnostic Medicine (AANEM) and American Academy of Physical Medicine and Rehabilitation (AAPM&R) [21].
Evaluation for possible DP was done by a separate physiatrist blinded to the results of the index test. First the recruited diabetic patients were examined for symptoms and signs of polyneuropathy. These symptoms and signs should have been symmetric and included: 1- Neuropathic symptoms including persistent or intermittent subjective numbness, altered sensation or pain; 2- Weakness or atrophy in distal legs; 3- Decreased distal sensation (pain, touch, temperature, vibration, proprioception) confirmed by physical examination; 4- Diminished or absent ankle deep tendon reflexes.
To have highest ordinal likelihood of diabetic polyneuropathy the patient should have abnormal electrodiagnostic tests as well as at least any 3 of the above signs and symptoms or 2 of the above, one of which to be neuropathic symptoms and the other one to be decreased distal sensation or diminished or absent ankle deep tendon reflexes. Any patient with enough abnormal signs and symptoms underwent electrodiagnostic studies to confirm or rule out the DP. Patients who did not have enough signs and symptoms could not fulfil the criteria of highest likelihood and were considered as not having DP.
During the electrodiagnosis session, the screening test was unilateral sural sensory measurement. In case of abnormal results, contralateral sural, bilateral ulnar and median sensory as well as bilateral median, ulnar, tibial and peroneal motor measurements with F waves were obtained. The minimum case definition criterion for distal symmetrical polyneuropathy was bilateral abnormality of any attribute of nerve conduction in two separate nerves one of which should be sural nerve [21].
Statistical analyses
The obtained values were analysed using SPSS version 18 (SPSS Inc., Chicago, Illinois, USA). Descriptive statistics (means and standard deviations) were reported for each nerve conduction value. To determine specificity and sensitivity of our index test we used 2 separate ways:
Traditional method in which we made a 2×2 table to calculate the diagnostic validity measures versus drawing the ROC curves and analysing them to determine the best cut off points to maximize sensitivity and specificity as well as the best suggested point for clinical use.
Results
The mean age of participants was 49±6 years (ranged 21 to 58 years). Patients who enrolled in the study had different duration of diabetes mellitus disease (minimum 1 month and maximum 25 years). Among 98 patients with diabetic mellitus enrolled in the study, 68 patients met the AANEM criteria of peripheral polyneuropathy.
The Pearson coefficient of the MFL latency and disease duration showed positive correlation. The Pearson correlation coefficient value of Tibial and Peroneal nerves were 0.35 and 0.28 respectively.
The specificity, sensitivity, positive and negative predictive value of the MFL of Peroneal and Tibial nerves displayed in Table 1.
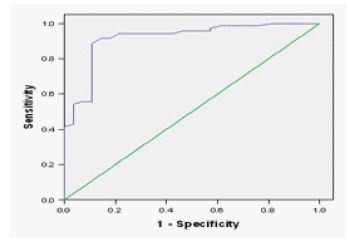
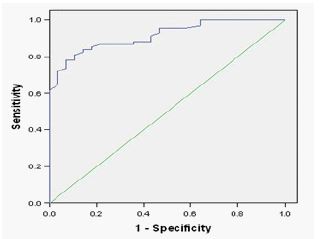
The MFL cut-off value with the highest sensitivity and specificity was determined for each nerve (Table 2). The ROC curve for the most specific and sensitive cut-off value was displayed in Figure 1 and 2 for Tibial and Peroneal nerves respectively. The area under the ROC curve measured 0.916 mm2 (±0.064, 95%confidential interval) for 48.80 ms cut-off value of Tibial nerve and 0.914 mm2 (±0.054, 95% confidential interval) for 48.15 ms Peroneal nerve MFL cut-off value.
Table 1: The sensitivity, specificity, positive and negative predicitive value of tibial and peroneal F-wave latency.
| Mean ± SD (millisecond) | Sensitivity | specificity | Positive predictive value | Negative predictive value | |
|---|---|---|---|---|---|
| Tibial | 52.66 ± 9.86 | 55% | 89% | 93% | 45% |
| Peroneal | 51.74 ± 6.64 | 60% | 100% | 100% | 51% |
Table 2: The highest sensitive and specific F-wave latency cut-off value for both Tibial and Peroneal nerves.
| Tibial nerve | Peroneal nerve | |||||
|---|---|---|---|---|---|---|
| Cut-off value (millisecond) | 42.00 | 54.40 | 48.80 | 44.20 | 51.80 | 48.15 |
| Sensitivity | 100% | 41% | 91% | 100% | 61% | 86% |
| Specificity | 18% | 100% | 86% | 36% | 100% | 79% |
Discussion
A sensitive electrophysiological measure is needed for early detection of DP or evaluation of the treatment efficacy [7]. Few studies have suggested MFL as a sensitive and reproducible measure [1-7,9-12] but none of them reported a standard diagnostic accuracy profile of MFL in a diabetic population using cross tabulation or ROC curves. Islam and colleagues reported the sensitivity of peroneal MFL in newly diagnosed diabetic patients as 53.1% [3], and Pastor and colleagues showed the sensitivity of tibial MFL in type I and II diabetes as 36.4% [4]. Relatively low abnormal results in these two studies are probably because one study was performed on newly diagnosed diabetic patients and the other study incorporated the diabetes type I subjects into the study which has lower rates of DP and younger population. Both studies only reported the percentage of abnormal results as an index of sensitivity which seems not to be an accurate method.
Targut and colleagues compared MFL in diabetic patients with non-diabetic patients [2]. Although it is important to know how MFL is different in diabetic people compared to normal population, studies to reveal diagnostic accuracy of this parameter in DP should be done on a sample of diabetic patients. Shin and colleagues and Andersen and colleagues reported Z scores as an index of sensitivity of MFL in diabetic patients [5,7]. Although, very useful, Z scores are less informative than diagnostic accuracy reports including sensitivity, specificity and positive and negative predictive values. Another shortcoming in the literature is lack of any ROC report for tibial or peroneal MFL in diabetic patients. ROC curves are strong tools to reveal the best cut-off point to be used in clinical settings or for screening purposes.
In this study, for the first time, we calculated the diagnostic accuracy values of both corrected and uncorrected tibial and peroneal MFLs in a diabetic population based on mean + 2SD as cut-off point of abnormal results. The results apparently reveal that correction of the MFL value for height should be a mandatory practice in clinics. Otherwise, diagnostic accuracy of the test will dramatically decrease. Simply dividing the MFL to patient’s height is an easy yet effective way to eliminate the effect of height on F wave latency [20]. Sensitivity and specificity of corrected tibial and peroneal nerves are high enough to suggest MFL as a non-invasive, easily performed test to be used as screening tool for DP. We recommend tibial MFL over peroneal MFL for this purpose as its sensitivity is over 90%.
ROC curves
We defined the most sensitive and specific cut-off values of MFL for both Tibial and Peroneal nerves by drawing ROC curves. For each nerve, we suggested cut-off point to maximize the sensitivity while holding the specificity as large as possible. This point can be used for screening purposes. Also, we suggested cut-off point to maximize the specificity while holding the sensitivity as large as possible. This point can be used to minimize the false positive results. Finally, we proposed the best cut-off point to have the largest sensitivity and specificity together. This point can serve best in clinical settings.
Looking into the sensitivity and specificity numbers we drew from corrected and uncorrected MFL cross tabulations and ROC curves, we can easily understand that cutoff values derived from ROC curves are most suitable to be used in daily practice of electrodiagnosticians. This is because it optimizes the sensitivity and specificity of the test at the same time.
Study limitations
One limitation of our study is lack of simultaneous comparison of MFL diagnostic accuracy with other electrodiagnostic parameters such as sural nerve amplitude, tibial or peroneal compound muscle action potential amplitude or radial/sural sensory amplitude. This way we could draw more accurate conclusions regarding the best screening tool for DP.
Another limitation of our study was the sample size. Our assumption for absolute precision on either side of the sensitivity was 0.08. Although we consider 0.08 as an acceptable precision, it would be ideal if we had enough resources to study on a larger sample size with precision of 0.05 or 0.06 on either side.
Conclusion
Lower limb F wave latency, especially when corrected for the height could be used as a strong tool in screening and diagnosis of DP. It is a low cost and non-invasive procedure which can be done within minutes. MFL ROC curves give us better cut off values to be used for screening purposes or in daily practice than average + 2SD cut off points.
Declarations
Ethics approval and consent to participate: The study was approved by the ethical committee of Rafsanjan University of Medical Sciences (grant number: 9/20/584) and the informed consent was written by all participants which may be provided to the journal on request.
Disclaimers and Source(s) of support: The authors declare that all data in the paper are real and authentic, they have full contribution to the article and the authors mentioned in the manuscript are the only contributors and they have no conflict of interest and they received no financial support.
References
- Karsidag S, Morali S, Sargin M, Salman S, Karsidag K, Us O. The electrophysiological findings of subclinical neuropathy in patients with recently diagnosed type 1 diabetes mellitus. Diabetes Res Clin Pract. 2005; 67: 211-219.
- Targut N, Guldiken S, Balci K, Tugrul A, Berberogly U, et al. Comparative neurophysiological study for the diagnosis of mild polyneuropathy in patients with diabetes mellitus and glucose intolerance. Int J Neurosci. 2006; 116: 745-759.
- Islam MR, Bhowmik NB, Haque A, Haque S, Haque A, Rhman HR, et al. F wave latency-a frequent and early involved nerve conduction parameter in young diabetic subjects. Mymensingh Med J. 2005; 14: 46-49.
- Pastore C, Izura V, Geijo-Barrientos E, Dominguez JR. A comparison of electrophysiological tests for the early diagnosis of diabetic neuropathy. Muscle Nerve. 1999; 22: 1667-1673.
- Shin JB, Seong YJ, Lee HJ, Kim SH, Suk H, Lee YJ. The usefulness of minimal f-wave latency and sural/radial amplitude ratio in diabethic polyneuropathy.Yonsei Med J. 2000; 41: 393-397.
- N Kohara, J Kimura, R Kaji, Y Goto, J Ishii, M Takiguchi, et al. F-wave latency serves as the most reproducible measure in nerve conduction studies of diabetic polyneuropathy: Multicentre analysis in healthy subjects and patients with diabetic polyneuropathy. Diabetologia. 2000; 43: 915–921.
- Andersen H, Stalberg E, Falck B. F-wave latency, the most sensitive nerve conduction parameter in patients with diabetes mellitus. Muscle Nerve. 1997; 20: 1296-1302.
- Panayiotopoulos CP, Chroni E. F-waves in clinical neurophysiology: A review, methodological issues and overall value in peripheral neuropathies. Electroencephalogr Clin Neurophysiol. 1996; 101: 365–374.
- Pan H, Jian F, Lin J, Chen N, Zhang C, Zhang Z, et al. F-wave latencies in patients with diabetes mellitus. Muscle Nerve. 2014; 49: 804-808.
- Sathya GR, Krishnamurthy N, Veliath S, Arulneyam J, Venkatachalam JF, et al. wave index: A diagnostic tool for peripheral neuropathy. Indian J Med Res. 2017; 145: 353–357.
- Dragana M, Srdjan P, Biljana P, Ivana P, Dejan N, et al. Neurophysiological evaluation in newly diagnosed Diabetes Mellitus type 1.Cent EurJ Medicine. 2013; 8: 503–508.
- Kulkarni AP, Saroja AO, Naik KR, Ghatnatti V, Hesarur N, et al. Nerve conduction abnormalities in patients with newly diagnosed diabetes mellitus. J Sci Soc. 2018; 45: 30-33.
- Kimura J, Yamada T, Stevland NP. Distal slowing of motor nerve conduction velocity in diabetic polyneuropathy. J Neurol Sci. 1979; 42: 291-302.
- Argyropoulos CJ, Panayiotopoulos CP, Scarpalezos S, Nastas PE, et al. F-wave and M-response conduction velocity in diabetes mellitus. Electromyogr Clin Neurophysiol. 1979; 19: 443-458.
- Fierro B, Modica A, D`Arpa A, Santangelo R, Raimondo D. Analysis of F-wave in metabolic neuropathies; A comparative study in uremic and diabetic patients. Acta Neurol Scand. 1987; 75: 179-185.
- [No authors listed]. Diabetes Control and Complication Trial (DCCT) Research Group: Effect of intensive diabetes treatment on nerve conduction in the diabetes control and complication trial. Ann Neurol 1995; 38: 869-880.
- Frazer JL, Olney RK. The relative diagnostic sensitivity of different F-wave parameters in various polyneuropathies. Muscle Nerve. 1992; 15: 912-918.
- Buderer NM. Statistical methodology: I. In corporating the prevalence of disease into the sample size calculation for sensitivity and specificity. AcadEmerg Med. 1996; 3: 895-900.
- Tahrani AA, Altaf QA, Piya MK, Barnett AH, et al. Peripheral and Autonomic Neuropathy in South Asians and White Caucasians with Type 2 Diabetes Mellitus: Possible Explanations for Epidemiological Differences. J Diabetes Res. 2017; 2017: 1273789.
- Mahmoudi H, Salehi Z, Azma K, Rezasoltani Z, Omidzohour MR, et al. F wave to height or limb length ratios as rational alternatives for F wave latency in cliniclelectrodiagnostic medicine. Clin Neurophysiol. 2011; 122: 2300-2304.
- England JD, Gronseth GS, Franklin G, Miller RG, Asbury AK, Carter GT, et al. Distal symmetrical polyneuropathy: A definition for clinical research. A report of the American Academy of Neurology, the American Association of Electrodiagnostic Medicine, and the American Academy of Physical Medicine and Rehabilitation. Arch Phys Med Rehabil. 2005; 86: 167-174.
- Puksa L, Stalberg E, Falck B. Reference values of F wave parameters in healthy subjects. Clin Neurophysiol. 2003; 114: 1079-9