
Journal of Clinical Images and Medical Case Reports
ISSN 2766-7820
Research Article - Open Access, Volume 4
Analyzing coronary bifurcation structures: Towards personalized balloon angioplasty and stent deployment
Kaitlyn M Elmer1*; Hailey Dirrigl1; Barry F Uretsky2; Adib Chaus2; Morten O Jensen1
1Department of Biomedical Engineering, University of Arkansas, Fayetteville, AR, USA.
2Department of Internal Medicine, University of Arkansas for Medical Sciences, Little Rock, AR, USA.
*Corresponding Author : Elmer KM
Department of Biomedical Engineering, University of Arkansas, Fayetteville, AR, USA.
Ph: 479-575-4216;
Email: mojensen@uark.edu
Received : Dec 27, 2022
Accepted : Jan 31, 2023
Published : Feb 07, 2023
Archived : www.jcimcr.org
Copyright : © Elmer KM (2023).
Abstract
Treating coronary artery disease in bifurcation lesions presents many practical challenges. Developing bifurcation-specific devices and procedures may improve results. In order to further understand angiographic bifurcation features, a set of healthy coronary artery bifurcations were measured and evaluated in order to develop models to predict carina diameter and tapering length for a new balloon forming system. Regression analysis for the carina diameter model showed r = 0.923, while regression analysis for the tapering length models showed r = 0.408. Carina diameters in healthy bifurcations were found to be 1.7-2.2x the diameter of the Pmv.
Keywords: Chordoma, MRI, pathomorphology, immunohistochemical analysis, early diagnosis, surgery, radiotherapy, complex treatment.
Abbreviations:CAD: Coronary Artery Disease; CD: Diameter At Carina; CL: Centerline; EED: Elliptical Equivalent Diameter; DMV: Distal Main Vessel; PMV: Proximal Main Vessel; SB: Side Branch; TL: Tapering Length.
Citation: Elmer KM, Dirrigl H, Uretsky BF, Chaus A, Jensen OM. Analyzing coronary bifurcation structures: Towards personalized balloon angioplasty and stent deployment. J Clin Images Med Case Rep. 2023; 4(2): 2275
Introduction
Multiple methods to treat bifurcation lesions have been proposed without consensus regarding the most effective and efficient method to provide immediate results and excellent long-term outcomes without complications. Despite multiple studies evaluating stenting of Distal Main Vessel (DMV) and SIDE BRANCH (SB) in true bifurcation lesions, long-term outcomes have not been definitively demonstrated to be superior to single main branch stenting when feasible (so-called “provisional” stenting approach). Many techniques have been described for a two stent system. Although there are differences in details and deployment, they all have the common element of two stent layers in a part or all of the bifurcation [1-4]. This feature likely explains in large part the increased risk of rest enosis compared with non-bifurcation lesions [5,6]. A simple and effective method to cover the bifurcation adequately with the minimum amount of stent material has remained elusive [3,7]. In theory, a bifurcation approach that covers the entire bifurcation core with a single stent may provide a method to minimize adverse long-term outcomes, particularly lesion rest enosis, which is highest at the ostium of the side branch [3,8].
A method which coined the “skirt and trousers” technique has been proposed [9]. In this technique, lesions in the proximal bifurcation region are covered with one stent (the “skirt”) and lesions in the distal branches are covered with additional stents (the “trousers”). However, for the “skirt” portion of the technique, no balloon-expandable stent exists that covers the carina effectively. In the same vein, a self-expanding stent (Axxess stent) that expanded in the PMV, was available commercially [10]. The self-expanding Axxess stent was funnel-shaped, widening at the carina and allowing for additional stent placement in the daughter branches. However, exact placement of a self-expanding stent can be challenging and represents a limitation of this type of device [10].
Additional methods of direct stent placement in the proximal vessel have been proposed (e.g., Szabo technique, reverse Szabo technique) [11-14]. We have proposed a “reverse balloon” concept, using two guide wires placed in each branch, so called “mother” (main) and “daughter” (side) branches [11]. The balloon catheter is advanced over both guide wires, allowing for precise balloon placement at the carina. Additionally, the balloon’s distal end is larger than the proximal end, creating a flared balloon. The larger distal end causes outward movement of plaque in the bifurcation core without compromising the side branch. These described techniques for stenting the PMV have the advantages of avoiding excessive stent overlap at the flow divider, overhanging struts in the SB ostium, and avoid endangering SB access, all of which are concerns with other techniques [2,15,16]. These advantages are all motivation for discerning which vessels are good candidates for PMV stenting and whether current stents will expand effectively to cover these regions.
Regardless of stenting method chosen, the stent must conform to the bifurcation geometry. Within the bifurcation, the vessel diameter may be considered to be widened to accommodate the split into two branches. Commercially available balloons and balloon-expandable stents are cylindrically shaped, which makes matching to the local geometry within the bifurcation core difficult. With many stenting techniques, overhanging struts are left in the ostium of the side branch. Many techniques (kissing balloons, for example) attempt to stretch stent struts out of the side branch ostium and towards the vessel wall opposite to the carina. Additionally, the previously described PMV stenting techniques involve placing stents that span the bifurcation core, touching the MV and SB walls opposite of the carina. In essence, cylindrically shaped stents must be stretched beyond the PMV diameter within the bifurcation core to match the widening of the vessel. Stents may be over expanded beyond their nominal diameters, and manufacturers provide recommended ratios of overexpansion. Stents may be expanded further ‘off-label,’ but cannot be expanded indefinitely [17,18]. Thus, measuring the largest diameter the stent must expand to cover is critical.
Additionally, general knowledge of bifurcation shape is important for the development of bifurcation-specific devices. For example, the Kissing Balloon Inflation Technique (KBI), i.e., simultaneous balloon inflation of the main and side branch, is often used. However, the effects of kissing balloon inflation are known to be mixed, with elliptical overexpansion in the main branch proximal to the bifurcation core being a concern [2,19]. Minimizing the region of balloon overlap in the PMV may improve stent shape be a caveat when using the technique [2,19-22]. Because of these considerations, knowledge of the overall length of the tapering region of the bifurcation may also be important for bifurcation-specific techniques and devices.
To restore the native geometry in the bifurcation region, some approximation of the pre-diseased shape is required. True bifurcation lesions tend to have stenoses in the outer walls of the bifurcation core, opposite to the carina [23-26]. The presence of these lesions makes direct measurement of the widest intended region in the bifurcation core difficult. Additionally, the length of vessel tapering is also difficult to directly measure when lesions are present in the SB ostium.
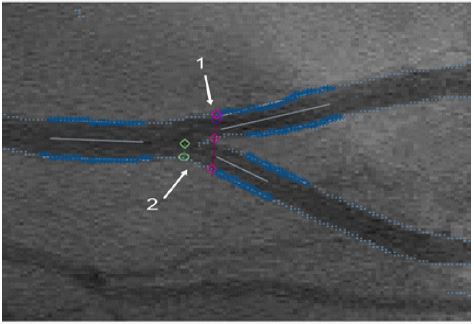
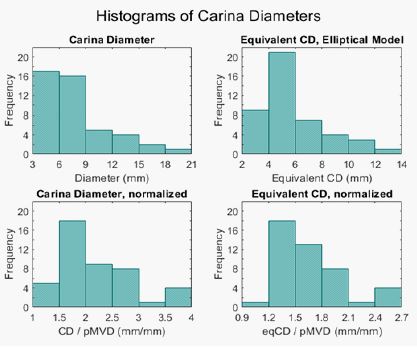
These issues lead to the two primary objectives of the present study. First, a healthy population of coronary artery bifurcations were measured to characterize the bifurcation. In addition to typically reported bifurcation measurements, which include diameters of each segment and the angles between each segment, two new parameters were defined and measured. The Carina Diameter (CD) was defined as the apparent diameter of the PMV at the carina and the Tapering Length (TL) was the distance from the side branch ostium point and the carina. The CD was also compared to the PMV diameter to determine the required overexpansion of stents (Figure 1). The second objective was to model the CD and TL of the bifurcation using other more easily acquired measurements. The data acquired from the healthy population was used to assess the utility of the models.
Methods
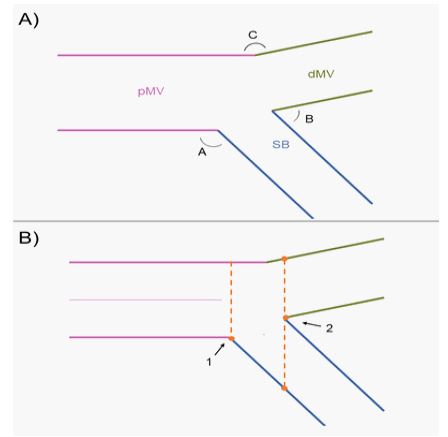
Define anatomical features of interest: First, relevant features of bifurcation anatomy were defined. As described elsewhere, the three branches of the bifurcation were called the Proximal Main Vessel (PMV), the Distal Main Vessel (DMV), and the Side Branch (SB) [7]. The angles between vessel segments were called A, B, and C, with angle A between PMV and SB, angle B between DMB and SB, and angle C between PMV and DMV. The diameters of each segment as well as the angles are commonly reported measurements [27]. These parameters are illustrated in Figure 2A.
Two additional geometric features called the Carina Diameter (CD) and Tapering Length (TL) were also defined. A concept like the CD measurement has elsewhere been called the final proximal diameter, though it has not been formally defined [28]. The CD was defined as the diameter of the vessel at a point passing through the vessel’s carina, measured along the direction of the main vessel. This can be more fully described by defining the centerline of the PMV and defining a carina line in the direction perpendicular to the PMV and intersecting the carina point. The CD is the length of the carina line starting and stop ping at the two outer walls of the vessel opposite to the carina. The tapering length was defined as the distance from the carina to the side branch ostium. An ostium line is defined from a point-slope line equation, with the point being the side branch ostium point and the slope being the same slope as the carina line. Then, the distance between the carina line and the ostium line is calculated to determine the TL. The CD, carina line, TL, ostium line, and carina are shown in Figure 2B.
Measuring geometry
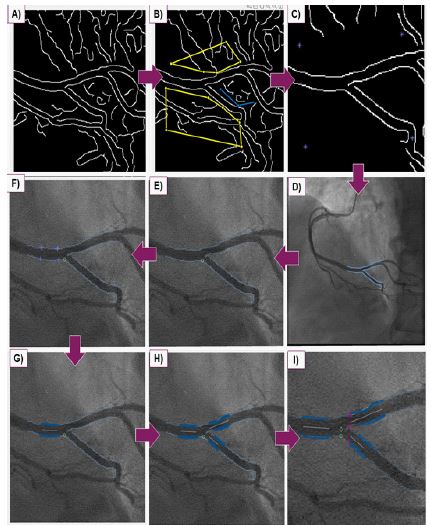
A method for reproducibly measuring the diameters and angles from angiogram images of human coronary arteries was developed. A custom Mat lab code (Mathworks, Natick, MA) was created for this purpose. First, a custom Canny-style filter detects possible edge points on the image. Next, the user indicates noise with a region-of-interest drawing tool. The detected edge points are then overlaid on the original angiogram image, and the user is prompted to select regions of edge points. For each of the three vessel segments (PMV, DMV, SB), the users were prompted to select four points on the lumen of the segment, with two points per lumen edge. The two points are used as starting and stopping points, and all edge points between the start/stop points are recorded. A first-order polynomial is fit to each edge, and first-order polynomial centerline is calculated and displayed. The angles between vessels are calculated between the centerlines of the three vessel segments. The user is then prompted to select the carina point and side branch ostium point of the vessel. With the carina point selected, a carina line is displayed to the user, as well as the starting/stopping points for the CD measurement. We found that the edge points are not always detected by the algorithm, and so the user may be required to manually adjust the start/stop points for the CD measurement, using the carina line as a guide. Finally, the user is prompted to select 4 catheter edge points, and catheter pixel width is found. The user inputs the French size of the catheter (French = 0.33 mm), so that the catheter pixel width can be used to convert all measurements to millimeters. Finally, the angles, diameters, and lengths, are displayed to the user. Figure 3 shows screen captures of the measurement process.
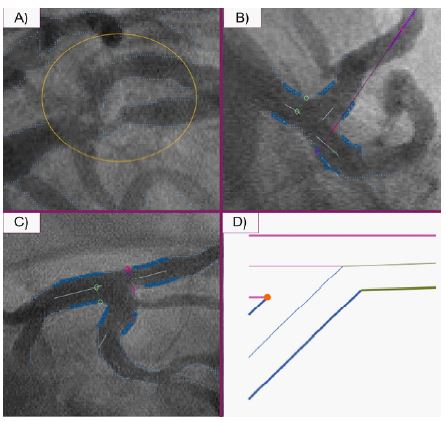
The described method was used to process 53 healthy bifurcations from 31 individuals. The angiogram images used were selected to minimize foreshortening of the vessels. Images with too low of contrast for effective filtering were not used in the final analysis, (2 total). Second, bifurcations where the carina diameter could not be measured were excluded from the final analysis (6 bifurcations). This was due to two reasons. First, the carina line intersected with the inner contour of the bifurcation before intersecting the outer contour, as shown in Figure 4. This typically occurred in vessels with A-angles near or less than 90 degrees or vessels that had more curvature. Secondly, T-shaped bifurcations with A-angles at 90 degrees had CD’s that were effectively infinite, rendering them unmeasurable.
To confirm repeatability among different users, three users analyzed 20 healthy bifurcations from the dataset, after being trained using three representative images. The Intraclass Correlation Coefficient (ICC) was used to rate the variability between users. The ICC is commonly used for this purpose, although the test is sensitive to the range of values in the sample measurements [29-31]. The ICC values range from 0-1, with 0-0.5 indicating poor user agreement, 0.5-0.75 indicating fair user agreement, 0.75-0.9 indicating good user agreement, and 0.9- 1.0 indicating excellent user agreement [30]. A two-way mixed model with absolute agreement was used for the analysis [30]. 95% confidence intervals for the ICC’s were also calculated, as the confidence interval gives a more holistic picture of the ICC rating.
Develop models for carina diameter and tapering length
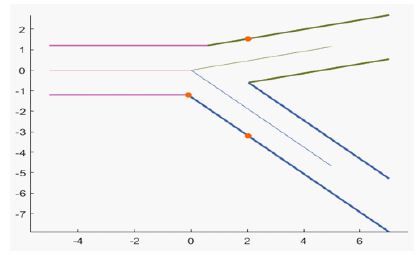
Since direct measurements of the CD and TL may be difficult in diseased vessels due to plaque presence, a 2D model of the bifurcation was developed and tested. The three branches of a bifurcation were modelled as three straight tubes. The measured A, B, and C angles defined the orientation of the tube centerlines, and the measured PMV, DMV, and SB diameters defined the size of the tubes. This model was created in MAT LAB, and is shown in Figure 5. The modelled CD and TL measurements were derived from this geometric model. For bifurcations with a angles < 90 degrees, modelling CD was difficult, as shown in Figure 4D.
Using the geometric model as a basis, the modelled carina diameter and taper length can be derived.
Carina Diameter:
TL=
In the equations, d_dMV is the diameter of the dMV, d_pMV is the diameter of the PMV, and d_sb is the diameter of the SB. A and C are the angles. All trigonometric functions use degrees. When the angle and diameter measurements are inputted, the CD and TL are estimated from these equations.
To analyze the accuracy of the models, regression analysis between measured and modelled groups was conducted. To do this, the measured CD’s and TL’s from the data set of 45 bifurcations were used. The corresponding diameter and angle measurements from each bifurcation were inputted into the mode land used to determine the modelled values of the bifurcation. SPSS software (IBM, Armonk NY) and p=0.05 was used for all statistical tests.
Determining required overexpansion of PMV stents
To estimate the feasibility for stents to over expand, the measured CD’s were compared to the measured PMV diameters. However, the CD measurement from a 2D projection may not satisfactorily describe the cross section of the 3D structure. To account for this, a secondary estimate of the required overexpansion was developed. Within the bifurcation core, the cross section of the vessel is not circular, but widens to accommodate the side branch ostium. An elliptical shape for the cross section at the carina may give a better estimate of the shape a stent expands to take at the carina. Stent overexpansion is often measured in relative diameter, so we have defined an Equivalent Ellipse Diameter (EED). This is econdary estimate uses the measured CD and the PMV diameter as the chords of an ellipse. The perimeter of the ellipse is calculated from Ramanujan’s equation, which has negligible error for our applications [32]. The elliptical perimeter is then plugged into the equation for the perimeter of a circle to calculate the EED.
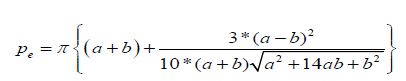
Equation 3: Ramanujan’s Equation for the perimeter of an ellipse. The chord lengths, a and b, are the CD/2 and pMVD/2 respectively.
EED= p_e/π
Equation 4: EED Calculation. p_e is the ellipse perimeter.
Results
53 bifurcations from 31 subjects were measured. 8 measurements were excluded due to previously-described limitations of the measuring system. 45 cases were kept for analysis.
User variability
The results of ICC’s and 95% confidence intervals for each measurement output are summarized in Table 1. Diameter and CD measurements were in the “excellent” range (>0.9 ICC), two of three angles (A and C) were in the “good” range, and angle B and TL were in the “fair” range.
Table 1: Intraclass correlation coefficients for bifurcation measurements. Three users measured 20 images. Values from 0-0.5 indicate poor reliability, 0.5-0.75 indicates fair reliability, 0.75-0.9 indicates good reliability, and 0.9-1 indicates excellent reliability. The 95% confidence interval gives the possible range for ICC, giving a more holistic view of the ICC. *Two outlier measurements were identified and excluded from the dMV calculation, on the basis of being impossibly large values. (>10 mm).
| Measurement | ICC | Lower Bound | Uppder Bound | Significance |
|---|---|---|---|---|
| Angle A | 0.881 | 0.770 | 0.947 | .000 |
| Angle B | 0.692 | 0.474 | 0.850 | .000 |
| Angle C | 0.835 | 0.691 | 0.925 | .000 |
| pMV diameter | 0.995 | 0.989 | 0.998 | .000 |
| dMV diameter* | 0.921 | 0.838 | 0.967 | .000 |
| SB diameter | 0.939 | 0.877 | 0.973 | .000 |
| Carina Diameter | 0.972 | 0.943 | 0.988 | .000 |
| Taper Length | 0.700 | 0.485 | 0.855 | .000 |
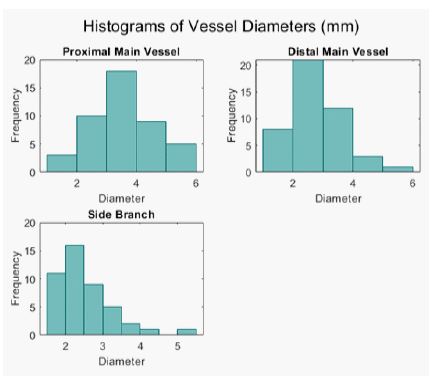
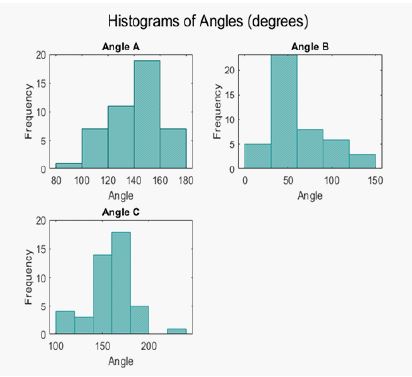
General measurements
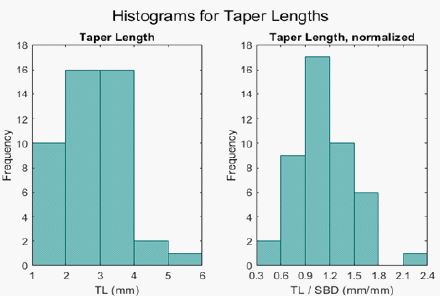
The means and standard deviations for each geometric measurement were calculated and are presented in Table 2. Histograms for CD and TL measurements are shown in Figures 6 and 7. Histograms for diameter and angles measurements are shown in Figures 1 and 2 of Appendix 1. The average PMV, DMV, and SB diameters aligned well with previously reported results [27]. The Finet ratio for each case was also calculated, as described elsewhere [27]. The mean Finet ratio for each case was 0.67+/- 0.09, which also aligns with previous reports [27]. If the CD is used to approximate the stent overexpansion diameter, stents on average are stretched 2.2 x beyond the diameter of the PMV to be apposed to the vessel walls at the level of the carina. The EED estimates that stents on average must be stretched to 1.7x the diameter of the PMV to have wall apposition at the carina.
Table 2: Summary of results from bifurcation measurements. Means and standard deviations of each measurement are presented.
| Measurement | Mean | Standard Deviation |
|---|---|---|
| Angle A (degrees) | 142 | 20 |
| Angle B (degrees) | 60 | 29 |
| Angle C (degrees) | 142 | 23 |
| pMV diameter (mm) | 3.6 | 1.1 |
| dMV diameter (mm) | 2.9 | 0.86 |
| SB diameter (mm) | 2.5 | 0.73 |
| Carina Diameter (mm) | 7.8 | 3.6 |
| CD / pMVD | 2.2 | 0.66 |
| Taper length (mm) | 2.8 | 0.83 |
| TL / SBD | 1.1 | 0.34 |
| EED (mm) | 5.9 | 2.4 |
| EED / pMVD | 1.7 | 0.38 |
Table 3: Summary of regression analysis.
| Measurement | r value | Regression Line | Significance |
|---|---|---|---|
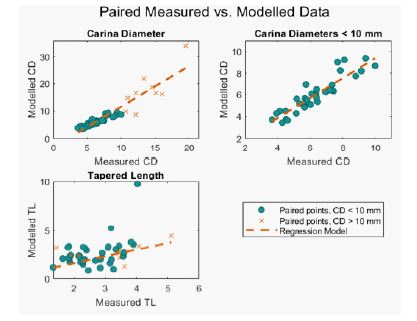
| Carina Diameter | 0.923 | y = -3.440 + x*1.500 | .000 |
| Carina Diameter < 10 mm | 0.921 | y = 0.155 + x*0.922 | .000 |
| Taper Length | 0.408 | y = 0.751 + x*0.692 | .005 |
Modeling of carina diameter and taper length: The CD and TL models were calculated for each case. The results from the regression analyses are summarized in Table 3. Scatter plots of measured vs. modelled values are also shown in Figure 8, with regression lines included. The spread for CD measurements appeared to increase for CD > 10 mm, so regression analyses were also conducted for the subgroup of CD < 10 mm.
Discussion
User variability
The ICC and 95% confidence intervals were in the good to excellent range for all measured diameters. This indicates that the described methods for measuring vessel diameters are highly reproducible. However, we have not confirmed the accuracy of our methods by comparing the measured diameters to known values. The variability in angle measurements is slightly lower, particularly for angle B. The slight curvatures in the examined vessels and user variation in selected edge points appears to be causing the angle measurement variation. To this end, as vessel curvature increases, user variation will likely increase. However, angle measurements begin to lose meaning as curvature increases, and this method would likely not be used for highly curved vessels.
The tapering length also saw decreased repeatability compared to other measurements. The exact location of the ostium point is often difficult to determine, as the SB and PMV lumens do not intersect at a sharp corner but rather are rounded.
The images utilized were collected in a 512 x 512 pixel formation. A higher pixel resolution would increase the differences between contrast and non-contrast sites, potentially decreasing user variability and increasing accuracy of the model.
Interpretation of general measurements
For measurements that are often taken and recorded for bifurcation lesions, our data align with previously reported averages [27]. Additionally, the Finet ratios for each vessel were also calculated and averaged to be 0.67 +/- 0.09, which aligns very well with the Finet model for vessel sizing ratios [27]. These findings strongly suggest that our study population and data collection methods are representative of a larger population and the results of this study generalizable.
To our knowledge, this is the first report of diameter measurements at the carina and side branch ostial distance (TL), though similar measurements have been taken before. Several commercially available software exist that can produce similar results, though for a much higher price [28,33]. The presently-described work may be used in conjunction with a custom balloon forming system, creating a customizable workflow.
The two estimates of maximum diameter, CD and EED, show that on average PMV stents must stretch from 1.7-2.2 x their original diameters to be opposed to the vessel walls at the carina. As this value is beyond the allowable amount of overexpansion in most stents, different stent types should be considered to make PMV stenting feasible for a larger number of bifurcation lesions.
Utility of models
Based on the Pearson correlation plots in Figure 8, the CD model appears to have a strong linear relationship with measured values, particularly for CD’s < 10 mm. The regression analysis showed a strong positive correlation, as evidenced by the r values shown in Table 3. A standardized residual plot showed tight clustering for smaller predicted values, and more spread for the larger values. These results indicate that our data was not homoscedastic, with variation between the modelled and measured CD’s increasing as the CD values increase. These results support the prediction that any curvature or inaccurate angle measurements will cause variation between the modelled and measured parameters. As the CD increases, these small variations are propagated and have a much larger impact on the model calculation.
The spread appeared visually to increase around 10 mm CD’s, so the CD measurements < 10 mm were analyzed separately. 37 out of 45 cases were < 10 mm, which accounts for 87% of values. The Pearson correlation plots and regression lines for CD< 10 mm are shown in Figure 8. This subset of the population also showed a strong positive correlation, with higher value and appearing to have minimal spread in the data. The standardized residual plot appeared random, indicating that the residuals are random for the test. This indicates that the modelled CD is valid for CD’s < 10 mm. However, this is only for bifurcations that exhibit the required characteristics that allow for a CD to be measured. Chiefly, limited curvature in the bifurcation and a angles >90 degrees indicate good candidacy for CD modelling.
The measured and modelled TL’s were also analyzed, and their correlation plots with regression lines are shown in Figure 7. Though the regression analysis had lower r values, when the histogram of normalized TL’s (TL/SB diameter) is examined, it shows that the majority of values are near 1. Additionally, the mean normalized TL is 1.1 +/- 0.33. Generally, as mentioned above, the exact SB ostium location is difficult to determine, and is variable among users. Again, this variation is because the PMV and SB lumens on the 2D projections do not meet at a point but rather at a rounded interface. All in all, these observations indicate that the complexity of the TL model may not be necessary, and that the SB diameter may be a reasonable estimate of TL.
The models for TL and CD have been developed to predict the pre-diseased bifurcation core dimensions. However, the calculation of both depends on other measurements that may be affected by the presence of disease. The measurements of the branch diameters may simply be taken proximally or distally of the stenosis. The angle measurements are more difficult to acquire and the use of a calculated centerline for estimating the angles are likely inaccurate, particularly for eccentric stenoses. Manual measurements with the use of digital calipers may be taken, though the user variability of this method has not been assessed.
Limitations
There are several limitations involved in this study. First, the samples were taken from manually selected 2D angiogram images. Although these orientations were selected to minimize foreshortening, these 2D projections still do not fully describe the complexity of the 3D shape. Additionally, the bifurcation vessels chosen were not sorted by coronary artery. For example, there may be differences between the CD’s of LM and LCX bifurcations. Finally, the sample size of 45 coronary bifurcations was small and may not reflect the population.
Future work
This work has been conducted to analyze bifurcation shape at the carina, and whether conventional stents placed in the pMV at the carina are likely to work for this purpose. To this end, we have assumed that stents placed in the PMV will expand radially into the SB at the carina, and appose to the vessel walls at the level of the carina. However, depending on strut design, rather than a radial expansion, individual struts may instead hinge at the SB ostium. Further work should confirm that stents placed from the PMV to the carina can be expanded to take on the shape of the bifurcation, as well as developing methods to deliver and shape stents to the intended geometries. We believe that flared balloons, as earlier alluded to, will aide PMV stent placement and expansion at the carina.
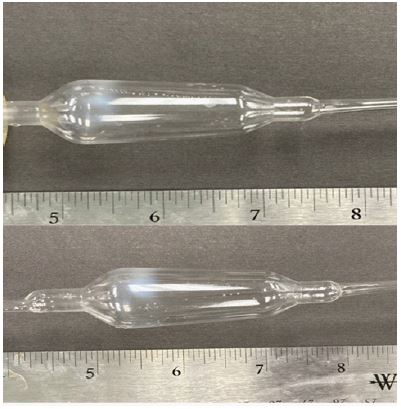
To this end, our measuring system has already been useful for work in custom balloon forming, with the measurements we have taken serving to guide dimensions of custom balloons [34].An example of a custom tapered balloon is shown in Figure 9.
For stenosed lesions, our measuring and modelling systems can directly feed the dimensioning of custom balloons. Future work will streamline a system of measuring stenosed lesions and producing custom balloons for angioplasty procedures.
Also, future work will explore the effects of restoration to the pre-stenos is carina diameter on characteristics of fluid flow and pressure drop across a bifurcation with stenosed sections. Each bifurcation is unique, due to bifurcation angle, percentage of stenosis within the carina, and placement of the plaque within the carina and SB ostium. The goal is to gain a better, quantifiable understanding of the fluid flow, specifically the pressure drops, within various simulations of diseased bifurcations before and after restoration. In doing so, procedures performed by the cardiovascular surgeons can be justified and/or potentially modified based on the results. Every case varies tom some degree and unless treatments are patient-specific, any stock size of balloon or stent is unlikely to be an exact match to the original anatomy. With this in mind, the effects of restoring geometry to measurements greater than or less than the original CD will be explored.
Conclusion
Conventional stenting techniques for angioplasty procedures in coronary bifurcations are far from perfect. With up to 20% of coronary interventions taking place in bifurcations, it is important to continue improving device design and stenting techniques to minimize the risks of adverse effects, such as restenos is or thrombosis. To this end, we have developed a method for measuring particular features of coronary bifurcations, including the CD and TL, as well as methods for modelling these values in stenosed lesions. We believe these values are key components for the development of new intervention techniques in PMV stenting at the carina, and can directly feed custom balloon dimensions to improve patient results.
Declarations
Acknowledgements: Special acknowledgement to the American Heart Association grant # 18AIREA33960590 as well as the Arkansas Research Alliance in supporting the funding for this research.
Thanks to Garrett Markham and Max Green for aiding in user variability data collection.
Funding: This study was funded by American Heart Association Grant # 18AIREA33960590.
Conflict of interest: The afuthors declare that they have not conflict of interest.
Ethical approval: This article uses deidentified patient data.
References
- S Cho. Long-Term Clinical Outcomes and Optimal Stent Strategy in Left Main Coronary Bifurcation Stenting. (in eng), JACC Cardiovasc Interv. 2018; 11: 1247-1258.
- R Albiero. Treatment of coronary bifurcation lesions, part I: Implanting the first stent in the provisional pathway. The 16th expert consensus document of the European Bifurcation Club. EuroIntervention. 2022; 18: 362-376.
- A Colombo, N Ruparelia. The Relentless Attempt to Perfect the 2-Stent Technique. JACC: Cardiovascular Interventions, Clinical Research Editorial Comment. 2015; 8: 960-961.
- J Lassen. Percutaneous coronary intervention for the left main stem and other bifurcation lesions: 12th consensus document from the European Bifurcation Club, EuroIntervention. 2018; 13:
- I Iakovou. Incidence, predictors, and outcome of thrombosis after successful implantation of drug-eluting stents, (in eng), JAMA. 2005; 293: 2126-2130.
- D Buccheri, D Piraino, G Andolina, B Cortese. Understanding and managing in-stent restenosis: A review of clinical data, from pathogenesis to treatment, (in eng), J Thorac Dis. 2016; 8: E1150-E1162.
- F Burzotta. Percutaneous coronary intervention for bifurcation coronary lesions: The 15, (in eng), EuroIntervention. 2021; 16: 1307-1317.
- A Colombo. Randomized study to evaluate sirolimus-eluting stents implanted at coronary bifurcation lesions, (in eng), Circulation. 2004; 109: 1244-1249.
- W Elabbassi AAl Nooryani, Skirt followed by trouser stenting technique: True anatomical preservation of coronary Y-shaped bifurcation lesions while using “vanishing” bioresorbable scaffolds: A report of two cases, (in eng), Cardiovasc Revasc Med. 2017; 18: 281-286.
- R John, D Jehangir, T Suneel, OK Peter. AXXESS– Stent: Delivery Indications and Outcomes, Interventional Cardiology Review. 2015; 10: 85.
- BF Uretsky. Apparatus and method for treatment of bifurcation lesions, (in en), Patent US8900207B2 Patent Appl. US12/201,871, 2014-12-02, 2014. [Online]. Available: https://patents.google.com/patent/US8900207B2/en
- HYang, J Qian, Z Huang, J Ge, Szabo 2-stent technique for coronary bifurcation lesions: Procedural and short-term outcomes, BMC Cardiovascular Disorders. 2020; 20: 2020.
- H Lo, MJ Kern. Use of a branch wire to anchor stents for exact placement proximal to bifurcation stents: The reverse Szabo technique. Catheterization and Cardiovascular Interventions. 2006; 67: 904-907.
- MJ Kern, D Ouellette, T Frianeza, A new technique to anchor stents for exact placement in ostial stenoses: The stent tail wire or Szabo technique, Catheterization and Cardiovascular Interventions. 2006; 68: 901-906.
- N Foin. Location of side branch access critically affects results in bifurcation stenting: Insights from bench modeling and computational flow simulation, (in eng), Int J Cardiol. 2013; 168: 3623-3628.
- J Lassen. Percutaneous coronary intervention for the left main stem and other bifurcation lesions: 12th consensus document from the European Bifurcation Club, Eurovision. 2018; 13.
- N Foin. Maximal expansion capacity with current DES platforms: A critical factor for stent selection in the treatment of left main bifurcations?, EuroIntervention. 2013; 8: 1315-1325.
- J Ng et al. Over-expansion capacity and stent design model: An update with contemporary DES platforms, International Journal of Cardiology. 2016; 221: 171-179.
- Y Murasato, G Finet, N Foin. Final kissing balloon inflation: The whole story, (in eng), Euro Intervention. 2015; 11: 81-85.
- J Liu, S Chen, J Wei, F Zeng, L Li Mini- versus classical kissing balloon inflation in provisional technique for bifurcation intervention, (in eng), J Interv Cardiol. 2018; 31: 75-764.
- J Liu. Modified kissing balloon inflation associated with better results after Culotte stenting for bifurcation lesions: A bench test, (in eng), Catheter Cardiovasc Interv. 2020; 96: E34-E44.
- L Gaid. Impact of Kissing Balloon in Patients Treated with Ultrathin Stents for Left Main Lesions and Bifurcations: An Analysis From the RAIN-CARDIOGROUP VII Study, (in eng), Circ Cardiovasc Interv. 2020; 13: e008325.
- G Nakazawa, SK Yazdani, AV Finn, M Vorpahl, FD Kolodgie, et al. Pathological findings at bifurcation lesions: The impact of flow distribution on atherosclerosis and arterial healing after stent implantation. (in eng), J Am Coll Cardiol. 2010; 55: 1679-1687.
- T Kırat. Fundamentals of percutaneous coronary bifurcation interventions, (in eng), World J Cardiol. 2022; 14: 108-138.
- JV. Soulis. Spatial and phasic oscillation of non-Newtonian wall shear stress in human left coronary artery bifurcation: an insight to atherogenesis, (in eng), Coron Artery Dis. 2006; 17: 351-358.
- B Fox, K James, B Morgan, A Seed. Distribution of fatty and fibrous plaques in young human coronary arteries, (in eng), Atherosclerosis. 1982; 41: 337-347.
- JA Ormiston. Bench testing and coronary artery bifurcations: A consensus document from the European Bifurcation Club, (in eng), EuroIntervention. 2018; 13: e1794- e1803.
- MJ Grundeken. The need for dedicated bifurcation quantitative coronary angiography (QCA) software algorithms to evaluate bifurcation lesions, (in eng), EuroIntervention. 2015; 11: 44-49.
- ZB Popović, JD Thomas. Assessing observer variability: a user’s guide, (in eng), Cardiovasc Diagn Ther. 2017; 7: 317-324.
- TK Koo MY Li. A Guideline of Selecting and Reporting Intra class Correlation Coefficients for Reliability Research, (in eng), J Chiropr Med. 2016; 15: 155-163.
- D Liljequist, B Elfving, K Skavberg Roaldsen. Intraclass correlation - A discussion and demonstration of basic features, (in eng), PLoS One. 2019; 14: e0219854.
- MB Villarino. Ramanujan’s perimeter of an ellipse, ed, 2008.
- C Collet, MJ Grundeken, T Asano, Y Onuma, W Wijns, et al. State of the art: Coronary angiography, (in eng), Euro Intervention. 2017; 13: 634-643.
- KM Elmer, MJ Bean, BF Uretsky, SE Stephens, HK Jensen, et al. Customizable Angioplasty Balloon-Forming Machine: Towards Precision Medicine in Coronary Bifurcation Lesion Interventions, (in eng), J Cardiovasc Transl Res. 2022; 15: 1119-1128.