
Journal of Clinical Images and Medical Case Reports
ISSN 2766-7820
Case Report - Open Access, Volume 2
Comparison and analysis of applications of ID3, CART decision tree models and neural network model in medical diagnosis and prognosis evaluation
Zeye Liu*; Xiangbin Pan
Department of Structural Heart Disease, National Center for Cardiovascular Disease, China and Fuwai Hospital, Chinese Academy of Medical Sciences and Peking Union Medical College, Beijing. Key Laboratory of Cardiovascular Appratus Innovation, Beijing 100037, China.
*Corresponding Author : Xiangbin Pan
Department of Structural Heart Disease, National
Center for Cardiovascular Disease, China and Fuwai
Hospital, Chinese Academy of Medical Sciences and
Peking Union Medical College, Beijing. Key Laboratory of Cardiovascular Appratus Innovation, Beijing
100037, China.
Email: panxiangbin@fuwaihospital.org
Received : Apr 12, 2021
Accepted : Apr 29, 2021
Published : May 04, 2021
Archived : www.jcimcr.org
Copyright : © Pan X (2021).
Abstract
Objective: To analyze the performance of each algorithm model under different processing conditions such as data preprocessing (standardization, normalization and regularization), balancing and shuffling based on the data attributes of three common research types in clinical studies as the research examples. To compare and analyze advantages and disadvantages of the decision tree model and the neural network model in clinical studies as well as their scope of application.
Methods: Python was used to construct ID3 and CART decision tree models. Three typical clinical research data sets were downloaded from UCI and used to perform data preprocessing, balancing, and shuffling on the models. The model evaluation indexes included time complexity, accuracy, precision, recall and F1-Score. As for visualization, the model results, confusion matrix and ROC curve were drawn. The importance rankings of different data set attributes on the model results were also analyzed. In addition, one typical data set was selected to conduct the comparative analysis by using the neural network model. SPSS was used to perform the significance analysis of different data processing schemes. The SPSS platform was used to conduct the statistical test of the results.
Results: (1) There were a total of 96 decision trees based on 2 decision tree algorithms, 3 data sets, 4 types of data preprocessing, 2 balanced choices and 2 shuffling choices. (2) The AUC value of the Thoracic Surgery Data Set significantly increased after balancing with a maximum increase of 0.3, which was statistically significant (P <0.01). (3) The AUC value of the Breast Cancer Wisconsin (Diagnostic) Data Set generally increased after normalization, which decreased after regularization. The maximum decrease was 0.6 without statistical significance (P = 0.3). (4) The AUC value of the Statlog (Heart) Data Set increased after regularization but it was not statistically significant. The maximum increase was 0.03. (5) Data balancing and shuffling can increase the AUC value. (6) The performance of the neural network model was between the best and worst performance of the decision tree model.
Conclusions: (1) Balancing and shuffling can increase the AUC value of unbalanced data significantly. (2) Data preprocessing can improve the quality of the model. The larger the amount of data, the more significant the effect. Normalization can be used to process data sets with great differences in feature distributions. Standardization can be used to process data sets with different magnitudes of data. Regularization can be used to deal with clustering problems. (3) The decision tree algorithm has a better performance for the classification of data sets with no obvious patterns. The neural network has more advantages in other data types and massive data processing.
Keywords: Medical; Decision tree model; Neural network model; Machine learning.
Citation: Liu Z, Pan X. Comparison and analysis of applications of ID3, CART decision tree models and neural network model in medical diagnosis and prognosis evaluation. J Clin Images Med Case Rep. 2021; 2(3): 1101.
Introduction
With its rapid development, data science has been widely used in various fields. According to a survey in KDnuggets Poll, the top five data science applications in 2016 were “Customer relationship management”, “Finance”, “Banking”, “Health Care” and “Scientific Research”. It can be seen that the medical and health field has become a hot field of data science application [1,2]. However, due to the privacy of medical data and the gradual strengthening of personal privacy protection, there still exists certain difficulties in medical data sharing among major medical centers, which often results in a smaller amount of data in a single study than that in other fields. And due to the complexity of the human body system and the diversification of measurement indicators, a study often involves multiple data forms. All of these has limited the application of machine learning data analysis to a certain extent.
In the field of clinical research, the requirements for the interpretability and provability of results are rather high. Therefore, the decision tree model has attracted more and more attention. The development of “Pruning” and “Integration” algorithm partly makes up for the limitations of decision tree model which is easy to over fit and difficult to promote [3,4]. However, neural network still has great advantages in nonlinear fitting, parallel processing, voice and image recognition, noise processing, learning hidden relationship and so on [5,6]. Therefore, whether there is the most appropriate data processing scheme and algorithm model in the common clinical research field, especially in the field of medical diagnosis and prognosis evaluation that clinicians are most concerned about, has become the focus of attention [7,8].
The evaluation of algorithm models and analysis results is multifaceted, and different emphasis will be given according to different research purposes. Therefore, in research, different classification thresholds are often used according to the task requirements. The threshold can be raised to make the prediction result of the classifier more reliable when more attention is paid to “Accuracy” while the threshold should be lowered to make the classifier predict more positive results for “Comprehensiveness”. Therefore, the generalization performance requirements of learners under different tasks shall be considered when setting the threshold [9]. Therefore, in this study, the Receiver Operating Characteristic Curve (ROC) was selected as the main standard for model evaluation from the perspective of threshold selection and reference was made to such evaluation indexes as time complexity, accuracy, precision, recall rate, and F1-Score.
Methods
Description of algorithms and data sets involved
In this study, 3 UCI data sets and 3 algorithms were involved.
Data sets
Thoracic surgery data set: This data set is used to predict the survival of patients one year after operation. It includes 470 samples and 17 attributes, including diagnosis, maximum vital capacity, forced expiratory volume per second, surgical score, preoperative pain, preoperative hemoptysis, preoperative dyspnea, preoperative weakness, tumor stage, diabetes history, myocardial infarction history, peripheral vascular disease, smoking history, asthma history, age, and follow-up results. In the data set, 70 samples survived one year later and 400 died, which was significantly unbalanced. In the experiment, all the 17 attribute values were used, with some features of the dataset distributed differently [10].
Statlog (heart) data set: This data set is used to predict whether the patient has heart disease. It includes 270 samples and 13 attributes, including gender, type of chest pain, resting blood pressure, serum cholesterol, fasting blood glucose, resting ECG results, maximum heart rate, exercise-related angina pectoris, exercise ST segment depression, slope of ST segment, number of vessels seen by fluoroscopy, and detection method. There were 120 patients with heart disease and 150 patients without heart disease in the data set. The numerical values between different features of the data set varied greatly.
Breast cancer wisconsin (diagnostic) data set: This data set is used to predict the benign and malignant breast tumors. It includes 569 samples and 32 attributes, involving the description of 10 cell nuclear morphology in pathology and oncology, including plexus thickness, uniform cell size, uniform cell shape, marginal adhesion, single epithelial cell size, naked nucleus, plain chromatin, normal nucleolus, mitosis, classification, etc. In the data set, 234 cases were diagnosed as benign and 335 as malignant. Different features were indicated by 1 to 10 [11].
Algorithms
ID3 decision tree: ID3 algorithm is a method to select the optimal description attribute according to the Entropy Deduce theory. The basis of attribute selection is to minimize the information entropy of nodes. The ID3 decision tree model was built using Python 3.5 and entropy was used as the best segmentation attribute decision method. The time complexity was approximately O (logn). Divide 75% of the data into the training set and 25% into the test set. SMOTE algorithm was used for oversampling balanced data. The data processing methods such as standardization, normalization, regularization, balanced and disruption are provided. ROC curve, confusion matrix, accuracy, precision, recall rate and F1 score were used to evaluate the model.
CART decision tree: CART is a binary tree. As a classification tree, the binary segmentation method is used and the binary division on each attribute is considered according to the Gini index, which is not easy to generate data fragments, and the accuracy is often higher than that of the multi-fork tree. When the minimum variance of the sample is used as the basis of node splitting, it can also be used for regression. The time complexity is approximately O (logn). The ID3 decision tree model was built using Python 3.5 and Gini was used as the best segmentation attribute decision method. The balanced data was oversampling by SMOTE algorithm. Divide 75% of the data into the training set and 25% into the test set. The same optional data processing method was provided and the same indicator was used to evaluate the model.
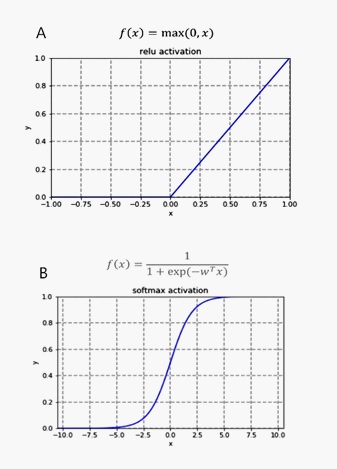
Neural network: Neural network is a complex network system formed by a large number of simple processing units connected with each other widely. In this study, the most basic three-layer fully connected neural network was used to compare the performance of a specific data set with the decision tree model. The time complexity is O (n). A 3-layer fully connected neural network was created using Python 3.5, with each layer of neurons being 128, 128, 1. In the first two layers, relu was used as the activation function and sigmoid was used as the activation function for the last layer. (Figure 1) Binary crossentropy was used as the loss function for this binary classification problem. Divide 400 data as training set and the rest as test set. A small batch of 16 samples was iteratively trained for 10 times. In the aspect of visualization, the curves of training loss, verification loss, training accuracy and verification accuracy were drawn. ROC curve, confusion matrix, accuracy, precision, recall rate and F1 score were used to evaluate the model.
Experimental design (methods and steps)
To build ID3 decision tree
1) ID3 algorithm was used to load the Theoretical Survey Data Set, Statlog (Heart) Data Set, Breast Cancer Wisconsin (Diagnostic) Data Set, with four operational options reserved, including no data preprocessing, standardization, normalization and regularization. Such four operational options were reserved as scrambled data, unscrambling data, balanced and unbalanced.
2. The influence of various processing measures on the performance of three data sets analyzed by the model was tested in turn, and the results included 48 cases, being 4*4*3.
3. ROC curve and confusion matrix were drawn to analyze the influence of data preprocessing, balance and disruption on different data sets. SPSS (version 23.0) was used to analyze the AUC value after each operation (P = 0.05). See source code and supporting materials for details.
To build CART decision tree
1. CART algorithm was used to perform the same operation on the above three data sets to generate 48 decision trees. See source code and supporting materials for details.
2. At the same time, ROC curve and confusion matrix were drawn to analyze the influence of data preprocessing, balance and disruption on different data sets and significant analysis was performed. See source code and supporting materials for details.
3. The advantages and disadvantages of the two algorithms in different data sets were analyzed and compared.
To build a fully connected neural network
1. Keras was used to build a three-layer fully connected neural network. The most common survival analysis data set in clinical (Thoracic Surgery Data Data Set) was selected for analysis, and ROC curve, confusion matrix, training loss, verification loss, training accuracy and verification accuracy curve were drawn.
2. Compared with the previous two models, the analysis of the advantages and disadvantages of different algorithms was mainly based on the AUC value, while referring to indicators such as time complexity, accuracy, precision, recall rate, and F1- Score.
Results
Result analysis of ID3 decision tree algorithm
Thoracic surgery data data set: In terms of the impact of data preprocessing, when the balance and disruption conditions were consistent, compared with the group without preprocessing, the AUC value was all increased in the three data preprocessing methods. The AUC value increased the most in the normalization group. In the non-disturbance and imbalance group, it increased by 0.08 while in the other groups, the value increased by 0.04. In terms of the impact of data scrambling, when the data preprocessing method was consistent with the balance situation, the data scrambling had no clear impact on the AUC value of the model. For example, the AUC value of the normalized and unbalanced groups decreases by 0.03, while the AUC value of the unbalanced and regularized groups increases by 0.04. In terms of the effect of balancing data, when the data preprocessing method was consistent with the scrambling situation, data balancing, that is, oversampling had no effect on the AUC value.
Statlog (heart) data set: In terms of the influence of data preprocessing, compared with the non-preprocessing group, the AUC values of the standardized group and the normalized group had both increase and decrease, while AUC value of the regularization group all increased, but there was no statistical significance, with a maximum increase of 0.03. The remaining two operations had no significant effect on the AUC value.
Breast cancer wisconsin (diagnostic) data set: The AUC value increased slightly after normalization compared with the non-preprocessing group, with a maximum increase of 0.03. The other treatments had no significant effect. After the data was balanced, the AUC value generally increased, but there was no statistical significance (P = 0.42). The AUC value generally increased after the data was scrambled, but it was also not statistically significant (Table 1).
Table 1: Corresponding AUC values for the 48 outcomes using the ID3 decision tree algorithm.
|
data set |
original |
standardization |
normalization |
regularization |
|
Not balanced |
nondisruptive |
Thoracic Surgery Data Set |
0.52 |
0.59 |
0.6 |
0.53 |
disruption |
Thoracic Surgery Data Set |
0.53 |
0.52 |
0.57 |
0.57 |
|
Balanced |
nondisruptive |
Thoracic Surgery Data Set |
0.7 |
0.84 |
0.74 |
0.77 |
disruption |
Thoracic Surgery Data Set |
0.71 |
0.8 |
0.86 |
0.82 |
|
Table 2: Corresponding AUC values for the 48 outcomes using the CART decision tree algorithm.
|
|
Data set |
Original |
Standardization |
Normalization |
Regularization |
Not balanced
|
Nondisruptive |
Thoracic Surgery Data Set |
0.51 |
0.54 |
0.52 |
0.53 |
Disorganize |
Thoracic Surgery Data Set |
0.53 |
0.61 |
0.56 |
0.51 |
|
Balanced |
Nondisruptive |
Thoracic Surgery Data Set |
0.81 |
0.78 |
0.79 |
0.7 |
Disruption |
Thoracic Surgery Data Set |
0.69 |
0.78 |
0.83 |
0.78 |
Result analysis of CART decision tree algorithm
Thoracic surgery data data set: All kinds of preprocessing had no obvious effect. After the data was balanced, the AUC was significantly increased, with the maximum increase being 0.3, and it was statistically significant (P <0.01). However, the AUC value increased or decreased after data scrambling, which was not statistically significant.
Statlog (heart) data set: All kinds of processing measures had no obvious effect.
Breast cancer wisconsin (diagnostic) data set: The AUC value generally increased after normalization compared with the non-preprocessing group, but decreased after regularization, with a maximum decrease of 0.6 (P=0.3). The other two processing measures had no significant impact. (Table 2).
Comparison between ID3 and CART decision tree algorithms
The accuracy, precision, recall rate and F1-Score indicators predicted by ID3 and CART algorithms on the three data sets were not significantly different. (See code and supporting materials for details) However, the AUC value all increased after data balance, disruption and any other kind of data preprocessing. In the CART algorithm, AUC value achieved 0.83, 0.78 and 0.97 respectively in the Theoretical Survey Data Set, Statlog (Heart) Data Set and the Breath Cancer Wisconsin (Diagnostic) Data Set while the AUC value reached 0.86, 0.76 and 0.97 respectively in ID3 algorithm.
Result analysis of neural network algorithm
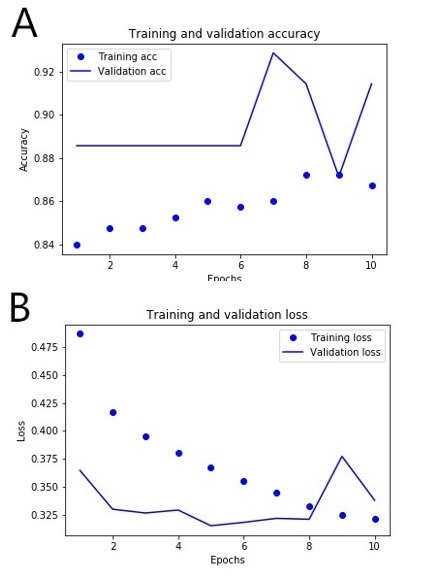
The AUC value was 0.68 by training the 3-layer fully connected neural network with Thoracic Surgery Data Data Set. It was lower than the best performance (0.83, 0.86) but higher than the worst performance (0.51, 0.52) of the two decision tree algorithms. According to the curve of training loss, verification loss, training accuracy and verification accuracy, over fitting had already appeared after 10 times of iterative training (Figure 2).
Discussion
Three data sets were used as examples in this paper. Problems such as inconsistent distribution of data features, extreme values and data noise can be found in clinical research. Normalization can map the data within the range of 0 to 1 and convert dimensional expressions into scalars. Standardization can change the average value of each feature to 0 and the standard deviation to 1 so that all features are at the same magnitude. Regularization can unify the standard for the similarity calculation, which is always used for clustering and text classification. [12] The results showed that the data preprocessing methods above increase the AUC value to a certain extent, but the effect was limited, which may be because of little difference from the standard data set feature distribution, presence of extreme values, small noise and overfitting resulting from no pruning of the decision tree.
At the same time, data balancing is essential because there is often imbalanced data in clinical research, especially in rare diseases and survival studies. The SMOTE algorithm can be used to a few new samples to effectively solve this problem. In particular, the AUC values increased significantly after data balancing when the Thoracic Surgery Data Data Set was used to train the CART algorithm, proving that the data balancing optimization model was effective in the unbalanced data set when its ratio of survival to death was 7:40. Data shuffling can disrupt the order of the data to randomize the data, thus improving the selectivity of the gradient optimization direction and avoiding overfitting. The AUC values generally increased after data shuffling in the Breast Cancer Wisconsin (Diagnostic) Data Set but there was no statistical significance, which may be because the data set was small, the batch gradient descent wasn’t used and the effect of the one-time training classifier was limited after data shuffling.
The difference between the ID3 algorithm and the CART algorithm lies in their selection of the optimal features used for data partitioning. The former uses the “Maximum information entropy gain” and the latter uses the “Gini index”. Besides, the CART algorithm can also be used for the regression analysis because it uses the minimum variance of samples as the node to split the data. As a classification problem in this study, each data set only presented differences in feature distributions and magnitudes, so the two algorithms didn’t show statistically significant advantages and disadvantages. Moreover, the pruning operation of the decision tree resulted in too many variables, so this study didn’t consider using the pruning operation to reduce irrelevant variables. There is no universal model. Although neural network models have developed rapidly in recent years, their performance was worse than that of decision tree models in this study, resulting from data set properties. In data types with obvious patterns such as images and sequences, neural networks have great advantages as they can efficiently extract the “Advanced” feature expressions. However, due to the table attributes of the data set in this study, only inefficient fully-connected neural networks can be used, so the effect was poor. Therefore, appropriate algorithm models should be selected for different data types in the study. Because the time complexity O (n) of neural networks is smaller than the time complexity O (logn) of decision trees, it will be more advantageous when large amounts of data need to be processed. The data volume in the data set in this study was small (only 569 samples at most), which also weakened the advantages of neural network algorithms. Besides, it is still necessary to discuss whether neural networks with different layers and neurons have better performance.
It is not appropriate to only use the AUC value of the ROC curve as the standard in clinical research, although it is a comprehensive index that accurately reflects the authenticity of diagnostic tests. The clinical application range may be completely different even if the AUC values are exactly the same. Therefore, it is still necessary to select comprehensive evaluation indexes based on the population characteristics as well as the clinical and socioeconomic influences of diagnoses [13,14].
Conclusions
The conclusions that can be drawn in this study are as follows:
1. Data preprocessing can improve the quality of the models. The larger the amount of the data, the more significant the effect. Normalization can be used to process data sets with large differences in feature distributions. Standardization can be used to process data sets with data of different magnitudes. Regularization can be used for clustering problems.
2. Data balancing plays an important role in processing imbalanced data sets.
3. Data shuffling helps to mitigate the overfitting and optimize the training results. But the performance is not significant when the amount of data is small.
4. The performance of fully connected neural networks is not as good as that of decision tree models for the classification problems in data sets without obvious patterns. But the performance of the two decision tree models is not significantly different. Therefore, decision tree models can be used to solve common problems such as diagnosis and prediction, survival analysis, and disease classification in clinical research. Moreover, operations such as preprocessing, balancing, and shuffling can be selected based on the amount of data, data types, and display requirements.
Ethics approval and consent to participate: Not applicable.
Consent for publication: Not applicable
Availability of data and materials: All the primary data and materials involved in this paper are from the published articles and web links, and they are all available online.
Funding: National Natural Science Foundation of China (81970444), Beijing Municipal Science and Technology Project (Z201100005420030), Sanming Project of Medicine in Shenzhen (SZSM202011013), WR program project (Research on therapeutic strategies and appliances for acute and severe cardiovascular diseases) 2020-RSW02.
Acknowledgement: Not applicable
References
- Lancet T. Moving toward precision medicine. Lancet. 2011; 378: 1678.
- Loh WY. Classification and regression trees. Wiley Interdisciplinary Reviews: Data Mining and Knowledge Discovery. 2011;1.
- Voitikova MV, Khursa RV. Mental Stress Testing Using Classification and Regression Tree. nonlinear phenomena in complex systems. 2015; 18: 38-43.
- Chaudhuri P, Lo WD, Lo WY , et al. Generalized regression trees. Stata Sinica. 1995; 5.
- Xie Y, Zhang J, Xia Y, Fulham M, Zhang Y. Fusing texture, shape and deep model-learned information at decision level for automated classification of lung nodules on chest CT. Information Fusion. 2018; 42.
- Hongyuan, Wang, et al. Novel image markers for non-small cell lung cancer classification and survival prediction. Bmc Bioinformatics. 2014.
- Zeng Xueyuan, Gong Weiguo, Hu Yunfeng, Ren Jixiang. Construction of prediction model of ischemic stroke recurrence based on decision tree algorithm. Jilin traditional Chinese medicine. 2020; 40: 437-440.
- Yifan L, Xiaohai L, Xinyu H, Penghao L, Xinjie B, et al. Prediction of Recurrence after Transsphenoidal Surgery for Cushing’s Disease: The Use of Machine Learning Algorithms. Neuroendocrinology. 2019; 108.
- Murphy KP. Machine learning: A probabilistic perspective. MIT press. 2012.
- Zięba M, Tomczak JM, Lubicz M, Świątek J. Boosted SVM for extracting rules from imbalanced data in application to prediction of the post-operative life expectancy in the lung cancer patients. Applied Soft Computing Journal. 2014; 14.
- Mangasarian OL, Street WN, Wolberg WH. Breast Cancer Diagnosis and Prognosis Via Linear Programming. 1995, 43.
- Mingji L, Xiufeng W, Yalou H. Data preprocessing in data mining. Computer science. 2000; 027: 54-57.
- Weizhong C, Xiaoping P, Xingbo S, et al. Selection of the best operating point in ROC curve. China health statistics. 2006: 157- 158.
- Jinghan W. Application of ROC curve in clinical medical diagnosis experiment. Chinese Journal of hypertension. 2008; 016: 175- 177.