
Journal of Clinical Images and Medical Case Reports
ISSN 2766-7820
Case Report - Open Access, Volume 2
Risk predictors selection and predict for the first-day neonatal mortality in Bangladesh using machine learning techniques
Afsana Tasnim Prima; Nishat Tasnim Thity; Rumana Rois*
Department of Statistics, Jahangirnagar University, Savar, Dhaka-1342, Bangladesh
*Corresponding Author: Rumana Rois
Department of Statistics, Jahangirnagar University,
Savar, Dhaka-1342, Bangladesh.
Email: rois@juniv.edu
Received : Nov 22, 2021
Accepted : Jan 12, 2022
Published : Jan 19, 2022
Archived : www.jcimcr.org
Copyright : © Rois R (2022).
Abstract
Although the neonatal mortality rate has been diminished over time in Bangladesh, the rate is still very high. The day of birth is the most vulnerable period for newborns. This study assessed to predict and detect associated risk predictors of the first-day neonatal mortality through Machine Learning (ML) algorithm. We investigated the potential risk factors on the information collected from 43,772 evermarried women of different backgrounds extracted from the 2014 Bangladesh Demographic and Health Survey (BDHS). Based on this demographic and socio-economic risk factors, our goal is to predict the prevalence of first-day neonatal mortality in Bangladesh. Analysis was done using different ML algorithms. Boruta algorithm and Support Vector Machine (SVM) were used to extract the relevant risk factors of the first-day neonatal mortality. Prediction of the prevalence of the first-day neonatal mortality was executed using Decision Tree (DT), Random Forest (RF), SVM, and Logistic Regression (LR), and their performances were appraised using different parameters of confusion matrix, Receiver Operating Characteristics (ROC) curves, and k-fold cross-validation techniques. About two-thirds of the firstday neonatal mortality occurred in the rural area. Male children had high neonatal mortality, with a rate of 51.2%. Mother Age at 1st birth, Husband/partner’s education level, Type of cooking fuel, Total children ever born, Wealth index, Mother’s education level, Access to media, and Type of place of residence were selected as significant risk predictors for predicting the first-day neonatal mortality. Results found that the SVM with Gaussian kernel (Accuracy = 0.8358, Sensitivity = 0. 8637, Specificity = 0.3333, Precision = 0.9588, area under the ROC curve (AUC) = 0.6596, k-fold accuracy=0.8530) performed better among the four machine learning models to predict the firstday neonatal mortality in Bangladesh. Machine learning framework can detect significant predictors of the first-day neonatal mortality, therefore may help the health-policymakers, stakeholders, and family members to understand and prevent this public health problem.
Keywords: infant health; decision tree; random forest; support vector machine; feature selection; logistic regression; boruta algorithm; confusion matrix; ROC; k-fold cross-validation.
Citation: Prima AT, Thity NT, Rois R. Risk predictors selection and predict for the first-day neonatal mortality in Bangladesh using machine learning techniques. J Clin Images Med Case Rep. 2022; 3(1): 1588.
Introduction
Being a newborn is not a disease, however, several children die soon after their birth. Meanwhile, the first month is the most climacteric period for child survival [1,2]. According to World Health Organization (WHO), neonatal death can be defined as “Deaths among children during the first 28 completed days of life” [1]. Neonatal death can be split into early neonatal deaths (deaths between 0 and 7 completed days of birth) and late neonatal deaths (deaths after 7 days to 28 completed days of birth) [3]. Nearly in every country, whether poor or rich, the first-day of birth is the most dangerous day for babies since the number of babies who die on the first-day of life is more than a million [4]. In developing countries, death among newborns between 28 days of birth acts as the prime factor that hinders improving the survival rate of children aged less than five years. Neonatal deaths alone are responsible for more than two-thirds of all deaths in the first one year of life and for about fifty percent of all deaths in under-five children [5,6]. The neonatal mortality rate of Bangladesh is 41 per thousand live births, which is the cause behind about half of the deaths of under-five children [7].
As per WHO, premature birth accounts for 30% of neonatal death globally, pneumonia for 27%, birth asphyxia for 23%, congenital anomalies for 6%, neonatal tetanus for 4%, diarrhea for 3%, and other reasons for 7% of all neonatal deaths [6,8,9]. According to Bangladesh Maternal Mortality Survey 2010, the main reason behind neonatal deaths, which are determined by the verbal autopsy, are low birth weight and premature delivery (11%), birth asphyxia (21%), sepsis (34%), and acute respiratory infections (10%) [10]. With the assistance of some high impact cost-effective, evidence-based interventions and expanded healthcare systems, many of these deaths are preventable [4,11]. Well-trained and equipped health care worker during the time of delivery is an effective solution [4]. Predicting the first-day neonatal mortality will contribute to lessening the deaths knowing the features, and at the same time achieving the target to meet Millennium Development Goal (MDG) 4 for child survival [12].
Plenty of researches focused on the prediction of neonatal mortality with the help of machine learning models [13- 22]. Machine learning models can accurately predict neonatal death, and Artificial Intelligence (AI) is the most frequently used predictor and metrics for neonatal mortality [23]. There is much work in the literature concerning infant mortality, early child mortality, and low birth weight in Bangladesh [15,24-27]. We are interested in classifying the first-day neonatal mortality and evaluating the performance of different ML models to predict first-day neonatal mortality in Bangladesh. We used birth record file data extracted from nationally representative BDHS 2014. The finding of this study can be beneficial to finding the risk factors (features) while predicting neonatal mortality on their first day.
Material and methods
Data sources and study design
The study used survey data from the Bangladesh Demographic and Health Survey (BDHS) 2014, which comprises Bangladesh’s districts and administrative divisions. This survey collects information from more than 17,000 households and more than 17,800 ever-married women. In BDHS 2014 survey, evermarried women aged 15-49 were interviewed. There are six different data files according to 6 different criteria. Our primary motivation is to predict the first-day neonatal mortality in Bangladesh. Here we consider only the birth record file, detailed information of this data is available at https://dhsprogram. com/data/available-datasets.cfm. The information related to child mortality on their first day was collected from reproductive mothers, and a total of 43,772 observations were included in the study. There are some missing cases in each variable in the study. Different socio-economic, demographic, and environmental factors including mother age, mother age at the time of 1st birth, education qualification, place of residence, division, wealth, sex and size of the child, place of delivery, exposure to NGO activity, access to media, toilet facilities, type of fuel used in cooking, respondent’s height and weight, Body Mass Index (BMI), number of children, husband/partner’s education level and occupation, number of antenatal visits during pregnancy, told about the pregnancy, complications, age at death, and firstday death. Here, first-day death act as a binary outcome variable, and the other factors act as exposure variables.
Statistical analyses
The study aimed to classify and predict neonatal mortality on the first-day using different machine learning models (DT, RF, SVM, LR). Our methodology involves data collection and processing, feature selection using Boruta algorithm. The evaluation process involved splitting the entire data set into training data sets and test data sets, applying ML models in the training data set, and evaluating the performance of these models on the test data set. Therefore, predicting child mortality on the first-day based on the entire data set using the best-performed model. The performances were evaluated using three performance parameters from the confusion matrix such as sensitivity, specificity, and accuracy, the area under the Receiver Operating Characteristics (ROC) curve (AUC), and the K-fold cross-validation. All ML models were performed using the scikit-learn module in Python programming language version 3.7.3. Only the Boruta algorithm was implemented to select the risk factors using the Boruta package in the R programming language [28].
Boruta algorithm
Boruta algorithm extracted the relevant risk factors for neonatal mortality on the first-day in Bangladesh using BDHS 2014 dataset. A wrapper approach built around a random forest classifier is used in this algorithm [29]. By adding randomness to the system and gathering results from the ensemble of randomized samples, the misleading impact of random fluctuations and correlations can be reduced by one. Therefore, this extra randomness provides a clearer view of which attributes are fundamental and remove the less relevant features [30].
Decision tree (DT)
Decision tree is the most commonly used ML technique that develops prediction algorithms for a target variable [31,32]. This method classifies a population into branch-like segments that construct an inverted tree with roots, internal, and leaf nodes [32] Without imposing a complicated parametric structure, the algorithm can deal with a vast quantity of data [32].
Random forest (RF)
Random forest is a tree-structured classifier with each tree depending on a collection of the random variable [33]. The goal is to find a predictor function that minimizes the expected loss value by determining the loss function [34]. We used 100 decision trees and Gini for impurity index to implement the random forests algorithm in Python.
Support vector machine (SVM)
Support vector machines are a set of related supervised learning methods [35]. The technique uses machine learning theory to maximize predictive accuracy; doing such, it over-fit the data automatically [36]. Structural Risk Minimization (SRM) principle is used in this formulation which has been shown to be superior, to the traditional Empirical Risk Minimization (ERM) principle, used by conventional neural networks [37].
Logistic regression (LR)
LR analysis is the study of the association between a categorical dependent variable and a set of independent (explanatory) variables [38]. The response variable’s outcome is divided into “failure,” which is represented by 1, and “success,” which is represented by 0 [39]. Unlike discriminant analysis, logistic regression does not assume that the independent variables are normally distributed [38].
Confusion matrix performance parameters
A confusion matrix is a representation of actual and predicted classifications done by a classification system [40]. It compares the predicted classification against the actual classification in the form of False-Positive (FP), True Positive (TP), False Negative (FN), and True Negative (TN) information while evaluating the performance [38,41].
Accuracy indicates the total number of correct predictions, sensitivity indicates how well a classification algorithm classifies data points in the positive class, specificity indicates how well a classification algorithm classifies data points in the negative class, and finally, precision indicates the number of data points correctly classified from the positive class [38,41].
Receiver operating characteristic curve
A Receiver Operating Characteristics (ROC) curve is a two-dimensional plot that visualizes, organizes, and selects classifiers based on their performance [42]. In this curve, the True Positive rate (TP = Sensitivity) is plotted as a function of the False Positive rate (FP = 1 - Specificity) [43]. The area under the ROC curve (AUC) measures how well a parameter can distinguish between two diagnostic groups [42].
K-fold cross-validation
In k-fold cross validation subsampling, the data set is randomly split k times. A model is built based on the k-1 parts of the data set called training data set. The accuracy of this estimated model is then evaluated on a test set. We choose the model which has the smallest cross-validation score [44,45]. Any pair of training and test set is disjoint as the sets don't have any common case [45].
Result and analysis
A total of 43,772 ever-married women of different backgrounds were included in the study from different districts of Bangladesh. Table 1 represents the frequency and percentage distribution of women from different socio-economic backgrounds. Among the 43,772 women, 30.9% (n =13,515) reside in urban area and 69.1% (n = 30257) women in rural area. Out of the total sample, only 5.1% (n = 2,237) of women has higher educational background while the majority of women, 34% (n =14,879), has no education, 32.7% (n = 14,295) complete their primary and 28.2% (12,361) complete their secondary education. A significant percentage of the husband comes from no educational qualification, 36.4% (n = 15,931 out of 43,769 samples). Child's birth size is average in most cases, with 67.3% (n = 3,184 out of 4,728 samples). 1665 Out of 3,525 women, 47.2% was told about their pregnancy complication earlier in the delivery. The mother's weight was mostly normal 57% (n = 24,711 out of 43,387 samples). Male children have higher neonatal mortality rate 51.2% (n = 22,396).
Table 1:Frequency and Percentage distributions of socio-economic characteristics.
Variables |
Number of Women (n) |
Percentage (%) |
Highest education level |
|
|
No education |
14879 |
34.0 |
Primary |
14295 |
32.7 |
Secondary |
12361 |
28.2 |
Higher |
2237 |
5.1 |
Type of place of residence |
|
|
Urban |
13515 |
30.9 |
Rural |
30257 |
69.1 |
Division |
|
|
Barisal |
5443 |
12.4 |
Chittagong |
7588 |
17.3 |
Dhaka |
7083 |
16.2 |
Khulna |
5672 |
13.0 |
Rajshahi |
5633 |
12.9 |
Rangpur |
5971 |
13.6 |
Sylhet |
6382 |
14.6 |
Wealth Index |
|
|
Poorest |
5269 |
12.0 |
Poorer |
9121 |
20.8 |
Middle |
9041 |
20.7 |
Richer |
8535 |
19.5 |
Richest |
7806 |
17.8 |
Sex of child |
|
|
Male |
22396 |
51.2 |
Female |
21376 |
48.8 |
Size of child at birth |
|
|
Very large |
104 |
2.2 |
Larger than average |
512 |
10.8 |
Average |
3184 |
67.3 |
Smaller than average |
621 |
13.1 |
Very small |
307 |
6.5 |
Access to media |
|
|
No |
19372 |
44.3 |
Yes |
24400 |
55.7 |
Exposure to NGO activity |
|
|
No |
38127 |
87.1 |
Yes |
5646 |
12.9 |
Toilet facilities shared |
|
|
No |
29009 |
68.4 |
Yes |
11866 |
28.0 |
Not a dejure resident |
1554 |
3.7 |
Type of cooking fuel |
|
|
Electricity |
124 |
0.3 |
LPG |
643 |
1.5 |
Natural gas |
4427 |
10.1 |
Biogas |
62 |
0.1 |
Kerosene |
28 |
0.1 |
Coal, lignite |
121 |
0.3 |
Charcoal |
129 |
0.3 |
Wood |
22990 |
52.5 |
Straw/shrubs/grass |
447 |
1.0 |
Agricultural crop |
9723 |
22.2 |
Animal dung |
3444 |
7.9 |
No food cooked in house |
1 |
0.0 |
Other |
79 |
0.2 |
Not a dejure resident |
1554 |
3.6 |
Husband/partner’seducation level |
|
|
No education |
15931 |
36.4 |
Primary |
12436 |
28.4 |
Secondary |
10666 |
24.4 |
Higher |
4736 |
10.8 |
Total labour pregnancy |
|
|
No |
1856 |
52.7 |
Yes |
1665 |
47.2 |
Don’t know |
4 |
0.1 |
Body mass index |
|
|
Under weight |
8534 |
19.7 |
Normal weight |
24711 |
57.0 |
Overweight & Obese |
10508 |
24.2 |
Table 2 represents the association between socio-demographic characteristics and the first-day death of children in Bangladesh. It exhibits that size of the child at birth has a significant effect on their death in very large child with (χ2 = 11.185, P-value < 0.05), total labor pregnancy complications (χ2 = 35.153, P-value < 0.05) and educational qualification (χ2 = 12.861, P-value < 0.05). The percentage of first-day death decreases significantly with the wealth index's rise (χ2 = 18.259, P-value < 0.05). The place of residence (P-value = 0.125) and BMI (P-value = 0.630) was statistically insignificant.
Table 2:Frequency and percentage distributions of first-day death of child in Bangladesh along with p-value of the chi-square (χ2) test.
Variables |
First-Day Death |
|
p-value |
|
No: n (%) |
Yes: n (%) |
|||
Highest education level |
|
|
|
|
No education |
14649 (98.5) |
230 (1.5) |
12.591 |
0.006* |
Primary |
14109 (98.7) |
186 (1.8) |
|
|
Secondary |
12213 (98.8) |
148 (1.2) |
|
|
Higher |
2220 (99.2) |
17 (0.8) |
|
|
Type of place of residence |
|
|
|
|
Urban |
13353 (98.8) |
162 (1.2) |
2.471 |
0.124 |
Rural |
29838 (98.6) |
419 (1.4) |
|
|
Division |
|
|
|
|
Barisal |
5384 (98.9) |
59 (1.1) |
26.603 |
<0.001* |
Chittagong |
7519 (99.1) |
69 (0.9) |
|
|
Dhaka |
6989 (98.7) |
94 (1.3) |
|
|
Khulna |
5586 (98.5) |
86 (1.5) |
|
|
Rajshahi |
5547 (98.5) |
86 (1.5) |
|
|
Rangpur |
5898 (98.8) |
73 (1.2) |
|
|
Sylhet |
6268 (98.2) |
114 (1.8) |
|
|
Wealth Index |
|
|
|
|
Poorest |
5134 (98.5) |
135 (1.5) |
18.259 |
0.001* |
Poorer |
9015 (98.8) |
106 (1.2) |
|
|
Middle |
8900 (98.4) |
141 (1.6) |
|
|
Richer |
8408 (98.5) |
127 (1.5) |
|
|
Richest |
7734 (99.1) |
72 (0.9) |
|
|
Birth order number |
|
|
|
|
Total |
43191 (98.7) |
581 (1.3) |
54.335 |
<0.001* |
Sex of child |
|
|
|
|
Male |
22048 (98.4) |
348 (1.3) |
17.966 |
<0.001* |
Female |
21143 (98.9) |
233 (1.1) |
|
|
Size of child at birth |
|
|
|
|
Very large |
104 (100) |
0 (0) |
|
|
Larger than average |
502 (98) |
10 (2) |
|
|
Average |
3160 (99.2) |
24 (0.8) |
11.185 |
0.030* |
Smaller than average |
616 (99.2) |
5 (0.8) |
|
|
Very small |
301 (98) |
6 (2) |
|
|
Access to media |
|
|
|
|
No |
19105 (98.6) |
267 (1.4) |
0.689 |
0.424 |
Yes |
24086 (98.7) |
314 (1.3) |
|
|
Exposure to NGO activity |
|
|
|
|
No |
37626 (98.7) |
501 (1.3) |
0.397 |
0.533 |
Yes |
5566 (98.6) |
80 (1.4) |
|
|
Toilet facilities shared |
|
|
|
|
No |
28634 (98.7) |
375 (1.3) |
3.598 |
0.168 |
Yes |
11695 (98.6) |
171 (1.4) |
|
|
Not a dejure resident |
1540 (99.1) |
14 (0.9) |
|
|
Type of cooking fuel |
|
|
|
|
Electricity |
118 (95.2) |
6 (4.8) |
29.458 |
<0.001* |
LPG |
633 (98.4) |
10 (1.6) |
|
|
Natural gas |
4380 (98.9) |
47 (1.1) |
|
|
Biogas |
62 (100) |
0 (0.0) |
|
|
Kerosene |
28 (100) |
0 (0.0) |
|
|
Coal, lignite |
120 (99.2) |
1 (0.08) |
|
|
Charcoal |
125 0 (96.9) |
4 (3.1) |
|
|
Wood |
22703 (98.8) |
287 (1.2) |
|
|
Straw/shrubs/grass |
442 (98.9) |
5 (1.1) |
|
|
Agricultural crop |
9572 (98.4) |
151 (1.6) |
|
|
Animal dung |
3388 (98.4) |
56 (1.6) |
|
|
No food cooked in house |
1 (100) |
0 (0.0) |
|
|
Other |
79 (100) |
0 (0.0) |
|
|
Not a dejure resident |
1540 (99.1) |
14 (0.9) |
|
|
Husband/partner’s |
|
|
|
|
No education |
15720 (98.7) |
211 (1.3) |
10.613 |
0.014* |
Primary |
12240 (98.4) |
196 (1.6) |
|
|
Secondary |
10543 (98.8) |
123 (1.2) |
|
|
Higher |
4685 (98.9) |
51 (1.1) |
|
|
Total labor pregnancy |
|
|
|
|
No |
1843 (99.3) |
13 (0.7) |
35.153 |
0.023* |
Yes |
1655 (99.4) |
10 (0.6) |
|
|
Don’t know |
3 (75) |
1 (25) |
|
|
Body mass index |
|
|
|
|
Under weight |
8421 (98.7) |
113 (1.3) |
0.962 |
0.619 |
Normal weight |
24373 (98.6) |
338 (1.4) |
|
|
Overweight & Obese |
10378 (98.8) |
130 (1.2) |
|
|
*Statistically significant at the 0.05 level.
Features selection
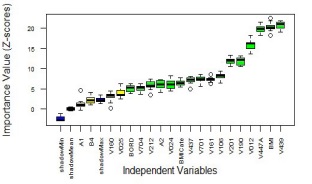
Figure 1 illustrates the result of the Boruta algorithm. With the help of this algorithm, we decided to keep 16 variables (Toilet facilities shared with other households, type of place of residence, birth order number, husband/partner's occupation, mother Age at 1st birth, access to media, division, BMI Category, respondent's height in centimeters, husband/partner's education level, type of cooking fuel, highest educational level, total children ever born, wealth index, maternal age, respondent' weight in kilograms, BMI) out of 25 variables.
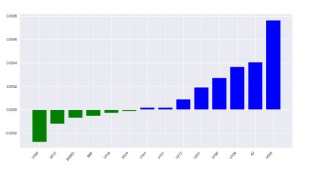
Hence, the important risk predictors of the first-day mortality were also explored using SVM. Once having the fitted SVM with linear kernel, then the important features can be determined by comparing the size of the classifier coefficients using .coef_ argument value. Figure 2 reveals those selected risk predictors with the blue bars and insignificant ones (which hold less variance)with the green bars. Here after, the main features (risk predictors) were identified using the Boruta algorithm and then using SVM. With the aid of SVM algorithm, eight variables, for instance, Mother Age at 1st birth (V212), Husband/partner's education level (V701), Type of cooking fuel (V161), total childrenever born (V201), Wealth index (V190), Mother’s education level (V106), Access to media (A2), and Type of place of residence (V025) were selected for predicting first-day mortality. These eight variables were used to evaluate Machine Learning models to classify first-day death in Bangladesh.
Machine learning models evaluation
In our study, we evaluated the performance of different Machine Learning Models with the help of confusion-matrix (Table 3), ROC curve for different models (Figure 2), and k-fold crossvalidation (Table 4). Table 3 reveals accuracy scores, sensitivity, specificity, and precisions of all mentioned machine learning algorithms by considering 70% observations as the training data and 30% observation as the test data with the random seeds 6484 using the scikit-learn module in Python. We found that LR was performed well among four ML algorithms based on accuracy score of 0.8533, followed by the SVM (Gaussian kernel) with an accuracy rate of 0.8358. However, LR could not be calculated for specification due to the convergence problem. Thus, we can say that the SVM algorithm performed well among these four ML algorithms in this scenario with an accuracy rate of 0.8358 (84% accurate prediction), 86.4% of positive cases that were predicted as positive (i.e., sensitivity = 0.8637), 33.3% of negative cases that were predicted as negative (i.e., specific ity = 0.3333), and 95.9% of positive predictions that were correct (i.e., precision = 0.9588).
Table 3:Accuracy, sensitivity, specificity and precision of different ML models.
Models |
Accuracy |
Sensitivity |
Specificity |
Precision |
DT |
0.7822 |
0.8818 |
0.2879 |
0.8601 |
RF |
0.8149 |
0.8219 |
0.3064 |
0.9454 |
SVM (Gaussian kernel) |
0.8358 |
0.8637 |
0.3333 |
0.9588 |
LR |
0.8533 |
0.8533 |
N/A |
1.000 |
Table 4:Result of K-Fold cross-validation of ML Models.
Models |
Accuracy (%) K-Fold |
|||
3-Fold |
5-Fold |
10-Fold |
30-Fold |
|
DT |
0.781 |
0.791 |
0.798 |
0.799 |
RF |
0.844 |
0.841 |
0.845 |
0.842 |
SVM(Gaussian kernel) |
0.852 |
0.853 |
0.853 |
0.853 |
LR |
0.852 |
0.852 |
0.853 |
0.852 |
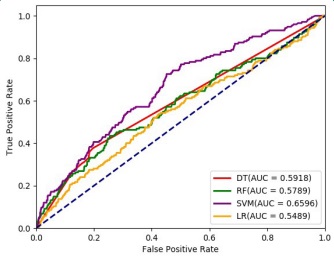
The ROC curves were calculated using the scikit-learn module with random seed 4856 in Python version 3.7.3, considering 70% observations as training data and 30% as test data. The area under the ROC curve (AUC) was estimated and plotted in Figure 3. The highest AUC was observed for SVM with Gaussian Kernel (0.6596), followed by Decision Trees (0.5918), RF (0.5789), and LR (0.5489).
Table 4 represent that Support Vector Machine model (with Gaussian kernel) performed better in 3-Fold, 5-Fold and 10-Fold cross validation. To predict the prevalence of first day neonatal mortality, SVM (with Gaussian kernel) algorithm performed consistently better. Therefore, SVM (with Gaussian kernel) perform better with precision, sensitivity, specificity andaccuracy along with ROC curve and K-fold cross validation approaches.
Discussion
In pregnancy and post-pregnancy, the most critical day is the day of birth for both mothers and their newborn babies. Although remarkable reductions have been made in neonatal mortality during the last two decades, the estimated death of neonatal mortality is 2.7 million every year [46]. A low-income country like Bangladesh needs a significant outreach of the abundance of neonatal death as a health issue. In 2000, neonatal mortality was neglected, therefore, resulting in increased mortality in the following year [47]. Hence, a better understanding of the causes responsible behinds the death is a key to lessening this problem. Motivated by this significant health problem and findings of [24], our study used to find the factors responsible for the first-day mortality using different Machine learning algorithms.
The study findings based on the chi-square test provide that the size of a child at the time of birth has a significant effect on first-day death along with total labor pregnancy complications and the mother's educational background. On the other hand, factor-like BMI, the mother's residence, NGO activity, and access to media affect insignificantly. Male children had a higher neonatal mortality rate than female children. An unborn child’s gender works as a significant factor in the death of a child on the first-day. However, ML techniques (Boruta algorithm and SVM algorithm) determined that eight variables, for instance, Mother Age at 1st birth, Husband/partner's education level, Type of cooking fuel, Total childrenever born, Wealth index, Mother’s education level, Access to media, and Type of place ofresidencewerethe selected features (significant risk factors) to predict the first-day death in Bangladesh.
We also considered different ML models to predict the firstday mortality in Bangladeshusing DT, RF, SVM, and LR. These ML models’ performances were evaluated using three approaches, for instance, different parameters of confusion matrix, Receiver Operating Characteristics (ROC) curves, and k-fold cross-validation techniques. Based on accuracy score, LR was performed better among these four ML algorithms with an accuracy rate of 0.8533 (85.3% accurate prediction), followed by SVM (83.6% accurate prediction). However, LR could not be calculated for specification due to the convergence problem. Consequently, the overall performance of SVM for a single run was better than all other ML algorithms, for instance, 86.4% of positive cases that were predicted as positive (i.e., sensitivity = 0.8637), 33.3% of negative cases that were predicted as negative (i.e., specificity = 0.3333), and 95.9% of positive predictions that were correct (i.e., precision = 0.9588), and area under the ROC curve (AUC) =0.6596. The k-fold Cross-validation (Table 4), which provides a solution based on several runs, also illustrated the better performance of SVM model (k-fold accuracy=0.8530) based on 3-Fold, 5-Fold, 10-Fold, and 30- Fold. According to these findings, SVM with Gaussian kernel performs better than all other machine learning approaches, therefore, SVM model will be more credible in predicting the first-day neonatal mortality in Bangladesh.
Conclusions
Based on the evidence of the study findings, we can conclude that ML algorithm can predict the first-day neonatal mortality with high accuracy and reliability. Our study indicates different socio-economic factors, including mother education, pregnancy complications, economic background, size of the child at birth, are the major risk factors. Education of the parents of the child act as an essential variable to minimize the risk rate. Safe delivery under trained caregivers can lessen the extremity of the vast problem. By detecting the significant factors with the accurate ML algorithm, the government and health policymakers can understand the complications and intervene to minimize this public health issue.
References
- WHO. Neonatal and perinatal mortality: Country, regional and global estimates. Geneva, Switzerland: World Health Organization; 2006.
- Desalew A, Sintayehu Y, Teferi N, Amare F, Geda B, et al. Cause and predictors of neonatal mortality among neonates admitted to neonatal intensive care units of public hospitals in eastern Ethiopia: A facility-based prospective follow-up study. BMC pediatrics. 2020; 20: 1-11.
- Alkema L, Chou D, Hogan D, Zhang S, Moller AB, et al. Global, regional, and national levels and trends in maternal mortality between 1990 and 2015, with scenario-based projections to 2030: A systematic analysis by the UN Maternal Mortality Estimation Inter-Agency Group. The lancet. 2016; 387: 462-474.
- Save the Children. Surviving the First Day: State of the World’s Mother 2012. Save the Children. 2013.
- Darmstadt GL, Lawn JE, Costello A. Advancing the state of the world’s newborns. Bulletin of the World Health Organization. 2003; 81: 224-225.
- Lawn JE, Cousens S, Zupan J, Lancet Neonatal Survival Steering Team. 4 million neonatal deaths: When? Where? Why? The Lancet. 2005; 365: 891-900.
- National Institute of Population Research and Training. Bangladesh demographic and health survey 2004. Dhaka: National Institute of Population Research and Training. 2005; 342.
- National Institute of Population Research and Training (NIPORT), Mitra and Associates, and ICF International. Bangladesh Demographic and Health Survey 2011. Dhaka, Bangladesh and Calverton, MD: NIPORT, Mitra and Associates, and ICF International; 2013. 9. World Health Organization. The World health report: 2005: Make every mother and child count. World Health Organization; 2005.
- Bryce J, Boschi Pinto C, Shibuya K, Black RE. WHO Child Health Epidemiology Reference Group. WHO estimates of the causes of death in children. The Lancet. 2005; 365: 1147-1152.
- Darmstadt GL, Bhutta ZA, Cousens S, Adam T, Walker N, et al. Lancet Neonatal Survival Steering Team. Evidence-based, costeffective interventions: How many newborn babies can we save? The Lancet. 2005; 365: 977-988.
- Chowdhury S, Banu LA, Chowdhury TA, Rubayet S, Khatoon S, et al. Achieving millennium development goals 4 and 5 in Bangladesh. BJOG: An International Journal of Obstetrics & Gynaecology. 2011; 118: 36-46.
- Batista AF, Diniz CS, Bonilha EA, Kawachi I, Chiavegatto Filho AD, et al. Neonatal mortality prediction with routinely collected data: A machine learning approach. BMC pediatrics. 2021; 21: 1-6.
- Ogallo W, Speakman S, Akinwande V, Varshney KR, Walcott Bryant A, et al. Identifying Factors Associated with Neonatal Mortality in Sub-Saharan Africa using Machine Learning. In American Medical Informatics Association (AMIA) Annual Symposium Proceedings. 2020; 2020.
- Sheikhtaheri A, Zarkesh MR, Moradi R, Kermani F. Prediction of neonatal deaths in NICUs: Development and validation of machine learning models. BMC medical informatics and decision making. 2021; 21: 1-4.
- Jaskari J, Myllärinen J, Leskinen M, Rad AB, Hollmén J, et al. Machine learning methods for neonatal mortality and morbidity classification. IEEE Access. 2020; 8: 123347-123358.
- Greenbury SF, Ougham K, Wu J, Battersby C, Gale C, et al. Identification of variation in nutritional practice in neonatal units in England and association with clinical outcomes using agnostic machine learning. Scientific reports. 2021; 11: 1-5.
- Raja R, Mukherjee I, Sarkar BK. A Machine Learning-Based Prediction Model for Preterm Birth in Rural India. Journal of Healthcare Engineering. 2021; 2021: 6665573.
- Masino AJ, Harris MC, Forsyth D, Ostapenko S, Srinivasan L, et al. Machine learning models for early sepsis recognition in the neonatal intensive care unit using readily available electronic health record data. PloS one. 2019; 14: e0212665.
- Açıkoğlu M, Tuncer SA. Incorporating feature selection methods into a machine learning-based neonatal seizure diagnosis. Medical hypotheses. 2020; 135: 109464.
- Beluzo CE, Alves LC, Silva E, Bresan RC, Arruda NM, et al. Machine Learning to Predict Neonatal Mortality Using Public Health Data from São Paulo-Brazil. med Rxiv. 2020.
- Lawoyin TO, Onadeko MO, Asekun-Olarinmoye EO. Neonatal mortality and perinatal risk factors in rural southwestern Nigeria: A community-based prospective study. West African Journal of Medicine. 2010; 29.
- Mangold C, Zoretic S, Thallapureddy K, Moreira A, Chorath K, Moreira A, et al. Machine Learning Models for Predicting Neonatal Mortality: A Systematic Review. Neonatology. 2021; 118: 394-405.
- Rahman A, Hossain Z, Kabir E, Rois R. Machine Learning Algorithm for Analysing Infant Mortality in Bangladesh. In: Siuly S, Wang H, Chen L, Guo Y, Xing C. (eds) Health Information Science. HIS 2021. Lecture Notes in Computer Science. 2021; 13079: 205- 219.
- Galib AH, Nahar N, Hossain BM. The Influences of Pre-birth Factors in Early Assessment of Child Mortality using Machine Learning Techniques. arXiv preprint. 2011; 09536.
- Borson NS, Kabir MR, Zamal Z, Rahman RM. Correlation analysis of demographic factors on low birth weight and prediction modeling using machine learning techniques. In Fourth World Conference on Smart Trends in Systems, Security and Sustainability, IEEE. 2020; 169-173.
- Rahman SJ, Ahmed NF, Abedin MM, Ahammed B, Ali M, et al. Investigate the risk factors of stunting, wasting, and underweight among under-five Bangladeshi children and its prediction based on machine learning approach. Plos one. 2021; 16: e0253172.
- R Core Team. R: A language and environment for statistical computing. Vienna: R Foundation for Statistical Computing http:// www.R-project.org/; 2013.
- Liaw A, Wiener M. Classification and regression by random Forest. R news. 2002; 2: 18-22.
- Kursa MB, Rudnicki WR. Feature selection with the Boruta package. J Stat Softw. 2010; 36: 1-3.
- Shalev S, David SB. Understanding Machine Learning: From Theory to Algorithms. Cambridge University Press, USA, 2014.
- Song YY, Ying LU. Decision tree methods: Applications for classification and prediction. Shanghai archives of psychiatry. 2015; 27: 130.
- Breiman L. Random Forests. Machine Learning. 2001; 45: 5-32.
- Cutler A, Cutler DR, Stevens JR. Random forests. In Ensemble machine learning. 2012; 157-175.
- Mantri JK. Comparison between SVM and MLP in predicting stock index trends. International Journal of Science and Modern Engineering (IJISME). 2013; 1: 81-82.
- Jakkula V. Tutorial on Support Vector Machine (svm). School of EECS, Washington State University. 2006; 37.
- Burges CJ. A tutorial on support vector machines for pattern recognition. Data mining and knowledge discovery. 1998; 2: 121- 167.
- Igual L, Seguí S. Introduction to Data Science. Springer, Cham. 2017.
- Sperandei S. Understanding logistic regression analysis. Biochemia medica. 2014; 24: 12-18.
- Provost F, Kohavi R. Glossary of terms. Journal of Machine Learning. 1998; 30: 271-274.
- Awad M, Khanna R. Efficient Learning Machines, Apress, Berkeley, CA. 2015. https://doi.org/10.1007/978-1-4302-5990-9_1
- Yang S, Berdine G. The Receiver Operating Characteristic (ROC) curve. The Southwest Respiratory and Critical Care Chronicles. 2017; 5: 34-36.
- Fawcett T. An introduction to ROC analysis. Pattern recognition letters. 2006; 27: 861-874.
- Bhatt S, Leiman PG, Taylor NMI. Tail Structure and Dynamics. In Reference Module in Life Sciences. Elsevier. 2019. https://doi. org/10.1016/B978-0-12-809633-8.20965-5.
- Jung Y, Hu J. AK-fold averaging cross-validation procedure. Journal of nonparametric statistics. 2015; 27: 167-179.
- World Health Organization. Making every baby count: Audit and review of still births and neonatal deaths, 2016.
- Shiffman J, Sultana S. Generating political priority for neonatal mortality reduction in Bangladesh. American journal of public health. 2013; 103: 623-631.