
Journal of Clinical Images and Medical Case Reports
ISSN 2766-7820
Research Article - Open Access, Volume 3
Recognizing and segmenting particles inside the respiratory system using texture descriptor and deep learning approaches
Atefeh Khadem1; Zohreh Mohammadi2; M Soltani2,3,4*
1Department of Mechatronic Engineering, K. N. Toosi University of Technology, Tehran, Iran.
2Department of Biomechanical Engineering, K. N. Toosi University of Technology, Tehran, Iran.
3Department of Mechanical Engineering, K. N. Toosi University of Technology, Tehran, Iran.
4Department of Electrical and Computer Engineering, University of Waterloo, Waterloo, Canada.
*Corresponding Author : M Soltani
Department of Electrical and Computer Engineering, University of Waterloo, Waterloo, Canada
Email: msoltani@uwaterloo.ca
Received : Aug 06, 2022
Accepted : Sep 01, 2022
Published : Sep 08, 2022
Archived : www.jcimcr.org
Copyright : © Soltani M (2022).
Abstract
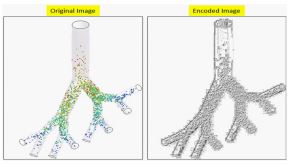
The study of aerosol deposition and bronchial tube flows in the human respiratory system can assistance improve an understanding of the damaging or beneficial effects of the inhalation of lung aerosols. In this study, we propose a strategy for segmenting the decomposition of particles inside the respiratory system. Firstly, a texture descriptor method is used to represent more unique features for obtaining the border of each particle more accurately. Next, the original image and the encoded image are applied to a Convolutional Neural Network model to generate the edge map of the input image. Lastly, a circle fitting approach to compare each object with a lot of potential circles is employed to find the best match and recognize the object. A comparison of the results obtained in this study with some texture descriptor approaches is demonstrated the good performance of our model.
Keywords: Human respiratory system; Deep learning; Texture descriptor; Convolutional neural network.
Citation: Khadem A, Mohammadi Z, Soltani M. Recognizing and segmenting particles inside the respiratory system using texture descriptor and deep learning approaches. J Clin Images Med Case Rep. 2022; 3(9): 2041.
Introduction
The respiratory system is a network of tissues and organs and is one of the most intricate systems in the human body [1]. The therapeutic effectiveness of inhaled aerosols depends on their spatial distribution within the respiratory tract and on the amount of the Active Pharmaceutical Ingredients (APIs) present in them [2-4]. However, the process of concentrating decomposed ambient particulate matter locally within the respiratory tract may lead to both lower and upper respiratory tract diseases [5-7]. Hence, detailed characterization of aerosol particle transportation and deposition is essential to quantitatively analyze their therapeutic and deleterious effects upon inhalation. Additionally, deposition of aerosol particles in airways plays a crucial role in the delivery of aerosol drugs [4,8].
The study of aerosol transport and deposition due to bronchial tube airflow can improve our understanding of the damaging or beneficial effects of their inhalation. The suspended particles in the aerosol are of numerous shapes and sizes ranging from nano-sized particles (diameter less than 1 μm) to large-sized pollens (diameter greater than 100 μm) including therapeutic aerosols, ultrafine dust, microbial aerosols, asbestos, pollen, and fumes [9-11].
Recognizing the size distribution of inhaled therapeutic/non-therapeutic aerosols is beneficial for assessing the harmful or useful effect of using aerosol. In this study, we aim to detect and segment the aerosol particle sizes into three parts of a respiratory system automatically using Machine Learning (ML) algorithms [8,11,12]. ML techniques employ a range of strategies and data to reproduce specific outputs from complex engineering/biological systems. Image segmentation algorithms are subsets of ML techniques and are vital to many computers vision and image processing applications [13-15]. Segmentation is employed in many image processing fields such as medical imaging [16,17], object tracking [18,19], and satellite imaging [20-22]. The wide use of the segmentation algorithms can be attributed to the segmentation outcomes that directly affect the performance of the whole system [20,23]. Image segmentation strategies are broadly classified into four categories: edge-based, region-based, threshold-based, and deep learning methods [24-26].
Region-based approaches primarily search for some seed points inside the image and appropriate region growing methods are employed subsequently to reach the boundaries of the objects [27,28]. Edge-based algorithms try to identify the edges or contours inside the input image. Therefore, segmentation is affected by a determination of the region margins inside the image. The threshold-based techniques generally employ the histogram of the input image for identifying single or multiple thresholds [29-31].
In the last few years, Deep Learning (DL) strategies have yielded remarkable success in better segmentation results compared to other hand-crafted feature extraction methods in the different fields of computer vision tasks [17,32-36]. Convolutional Neural Networks (CNNs) are considered a type of DL model with high abilities for extracting and learning crucial features. Moreover, CNN models are able to obtain the best possible features needed for feeding to other models (classic models) [37,38].
In this study, we suggest a CNN-based strategy to recognize and segment particles inside the respiratory system. To investigate the decomposition of particles, the Weibel Airway (WA) model [39] was adopted in this study as indicated in Figure 1.

The remaining parts of this paper are organized as follows: Initially, a texture descriptor approach is described in section 2.1. The characteristics and architecture of the suggested CNN model are presented in section 2.2. In section 2.3, we propose a matching strategy to find all particles inside the image. Section 3 describes the implementation details of the suggested model. Section 4 provides the conclusions.
Materials and methods
This section is divided into two sub-sections. Firstly, we describe the textural analysis that is useful to identify some sigsignificant textural information. We subsequently describe the procedure for finding more informative features to identify the border of objects by employing a CNN model.
Texture analysis (2.1)
Textural information as image features is very valuable in many computer vision and image processing applications [40,41]. There is a broad literature on textural analysis in the machine vision literature where the principal emphasis has been on synthesis, segmentation, and classification. Textural information is used as input features and has been employed in different applications such as medical image analysis, text analysis, and aerial and satellite image analysis as a descriptor [30,42,43].
In texture segmentation and classification, the aim is to divide the input image into a set of similar textured regions (homogeneous). Some of these similarities are size, orientation, shape, texture, pattern, color, etc [44,45].

In order to characterize textured images, various texture feature extraction techniques have been suggested. One can use traditional algorithms that employ a co-occurrence of matrix-based methods [33], fractal analysis [46], and filter-based approaches such as Gaussian Markov random fields [47], wavelet [48], and Gabor [23]. The Local Directional Pattern (LDP) technique is one of the most popular strategies that focus on the boundaries of objects in pre-defined directions [49]. Hence, LDP is able to recognize more prominent edges using an edge detection approach called “Kirsch filters”
Kirsch filters (Kirsch kernels) are non-linear edge detectors and are utilized to explore the edge response values in eight directions in the vicinity. The results of applying Kirsch kernels to an input image are demonstrated in Figure 2. LDP features are achieved by calculating the obtained edge maps at each pixel position in all eight compass directions and creating a code from relative strength magnitude [49,50]. LDP converts the directional information of input images. Each bit of code is generated by considering local vicinity and obtaining robustness in noisy situations. The result of applying the LDP approach to an input image is demonstrated in Figure 3.
Our deep learning model (2.2)
In the previous step, we used a texture descriptor approach to extract significant features that are crucial in detecting the edges of all particles precisely. In this section, by employing a Convolutional Neural Network (CNN), we classify all the pixels inside the image into edge and non-edge type of pixels. By doing so, the exact borders of all circular objects (some of them are not visible completely) inside the image are detected.
The CNNs are popular and widespread deep learning (DL) pipelines that have become one of the most successful techniques in the field of machine learning (ML). Typically, a CNN structure consists of four layers: 1) convolutional, 2) pooling, 3) activation, and 4) fully-connected layers [37,41].
The convolutional layers (conv layers) aim to learn hidden patterns and feature representations of the inputs [51]. Each neuron inside the feature map is connected to an area of neighbouring neurons in the prior layer. Such neighbourhoods are referred to as the neuron’s receptive fields in the last layer. The new feature map is generated by convolving the input with a learned filter. For generating each feature map, the filter is shared by all spatial locations of the input [38,52,53].
Similar to conv layers, pooling operators include a predefined patch (window) that is slid over all areas in the input based on its stride, calculating an output for each point traversed by the pooling window [54]. However, unlike kernels in the convolutional layer and the cross-correlation computation of the inputs, the pooling layer contains no kernel. Normally, pooling operators calculate either the average (mean-pooling) or the maximum (max-pooling) value of the elements in the pooling window [26,55].
The Fully Connected Layers (FC) can end up with a Soft Max (SM) output layer to classify the input. The SM activation function is utilized in the output layer and is a multi-class version of the logistic regression [26,56,57].
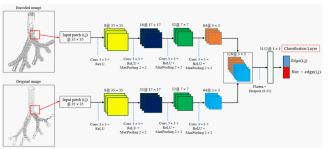
The employed CNN model is shown in Figure 4 and has two similar feature exploration routes for extracting high-level and low-level features. Each feature extraction route has four convolutional layers. The first two and the last two conv layers explore low-level and high-level features, respectively. The number of utilized filters in each route increases with the depth: 8, 16, 32, and 64. A Rectified Linear Units (ReLU) layer is utilized for applying activation function in an element-wise manner.
This layer is able to convert all the negative values to zero. We utilized a 2×2 max-pooling layer after each conv layer to decrease the dimension of the obtained feature maps. Moreover, in order to avoid memorization, a dropout of 0.15 is used. For increasing the training samples, two augmentation strategies are utilized including random rotations and random Gaussian noise [26,32,58]. The utilized parameters for training the CNN model are shown in Table 1.
Table 1: The course of endoscopic treatments.
| Parameters | Value |
|---|---|
| Patch size | 35x35 |
| Optimizer | Adam |
| Output number | 2 |
| Learning rate | 0.001 |
| Batch size | 7000 |
| Learning Rate Drop Factor | 0.15 |
| Max Epochs | 50 |
Finding circular objects (2.3)
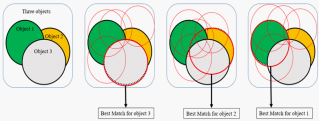
In the last section, we extracted all edges of objects. In this part, we propose a searching approach that draws some circles around each object (local area) to find the best match. This process is demonstrated in detail in Figure 5. Inside a loop with 100 iterations, we generate different circles (red circles in Figure 5) with random radiuses (close to the target radius). Next, by comparing the border of generated circles with the target, we are able to find the best circle that represents the occluded target and can be added to a list for finding the whole objects. In other words, we calculate the over fitting pixels created by overlapping both borders of the object and the border of the generated circle to find the best fit.
Experiments
Assessment metrics
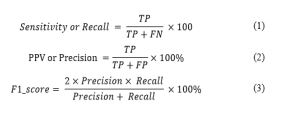
Three techniques are employed to evaluate the segmentation performance, including recall, precision, and F1-score. Sensitivity or recall is the True Positive Rate (TP). In other words, it is calculated by dividing the number of correct positive predictions by the summation of true positive and False Negative (FN). In addition, precision is calculated by dividing the true positive by the total of true positive and False Positive (FP).
Experimental results and discussions
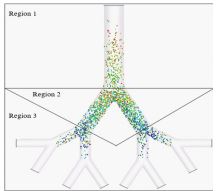
We conduct experiments on a private dataset containing 10,000 images with the dimensions of 520×640. For evaluating the proposed method more accurately, we divide the respiratory system into three regions (upper, middle and lower) and evaluate each area separately. Figure 6 shows an example of dividing the respiratory system into three parts.
To have a clear understanding for comparison purposes, we use four other texture descriptors (Local Binary Pattern (LBP) [40], Local Directional Number Pattern (LDNP) [41], Local Ternary Pattern (LTP) [59], and Fuzzy Local Ternary Pattern (FLTP) [60] to evaluate the segmentation performance. Quantitative results of different kinds of our structure are described in Table 2.
For each index in Table 2, the highest PPV, Sensitivity, and F1-score are highlighted in bold. The results in Table 2 clearly demonstrate that our technique is able to obtain the highest sensitivity values in regions 1 and 2 and the highest score for region 3 is obtained by LDNP. The structures based on LTP and FLTP have achieved good accuracy, but these approaches may or may not work if given more color similarity in the local areas inside the input images. Besides, there is a minimum difference between the values of PPV using LTP and FLTP. Another interesting point is that the worst scores for all measures are obtained using LBP in all areas. Additionally, the segmentation results in terms of PPV using LBP, LTP, and FLTP methods are generally under 90%. By employing the LDP strategy, all criteria are improved in comparison to other approaches, but the sensitivity value in region 3 employing LDNP is still higher.
Discussion and conclusions
In this work, we presented a method for segmenting aerosol-based particles inside the respiratory system. We initially employed a texture descriptor technique to represent more unique features and for obtaining the border of each particle (object) more accurately. Then, by applying the original image and the encoded image to a CNN model, an edge map of the input image is created. The network only requires reasonable data for the training phase. Lastly, we suggested a fitting circle approach to compare each object with a lot of potential circles to find the best match and recognize the object. A comparison of the results obtained in this study with some texture descriptor approaches is given in Table 2. The comparison with these approaches demonstrates that the proposed method segment aerosol-based particles in the respiratory system with at least a 5% improvement in precision.
Table 2: Comparison between the results of our strategy using the LDP model and four different texture descriptor techniques.
| Method | PPV (%) | Sensitivity (%) | F1-score (%) | ||||||
| Region 1 | Region 2 | Region 3 | Region 1 | Region 2 | Region 3 | Region 1 | Region 2 | Region 3 | |
| Local Binary Pattern (LBP) [40] | 76 | 72 | 71 | 74 | 71 | 68 | 75 | 71 | 69 |
| Local Directional Number Pattern (LDNP) [41] | 89 | 86 | 85 | 91 | 90 | 88 | 90 | 88 | 86 |
| Local Ternary Pattern (LTP) [59] | 86 | 82 | 82 | 88 | 86 | 83 | 87 | 84 | 82 |
| Fuzzy Local Ternary Pattern (FLTP) [60] | 87 | 82 | 83 | 89 | 84 | 83 | 88 | 83 | 83 |
| Proposed method (LDP) | 94 | 93 | 90 | 93 | 91 | 87 | 93 | 92 | 93 |
Funding: The funding sources had no involvement in the study design, collection, analysis or interpretation of data, writing of the manuscript or in the decision to submit the manuscript for publication.
Declaration of interests: We declare no conflict of interest.
References
- NE Robinson, PW Furlow. Anatomy of the respiratory system. Equine respiratory medicine and surgery. 2007; 3-17.
- L Augusto, J Gonçalves, G Lopes. CFD evaluation of the influence of physical mechanisms, particle size, and breathing condition on the deposition of particulates in a triple bifurcation airway, Water, Air, & Soil Pollution. 2016; 227: 1-13.
- Y Kim, Z Tong, H Chan, R Yang. CFD modelling of air and particle flows in different airway models. Journal of Aerosol Science. 2019; 134: 14-28.
- B Soni, S Aliabadi. Large-scale CFD simulations of airflow and particle deposition in lung airway. Computers & Fluids. 2013; 88: 804-812.
- D Gao, S Ripley, S Weichenthal, KJG Pollitt. Ambient particulate matter oxidative potential: Chemical determinants, associated health effects, and strategies for risk management. Free Radical Biology and Medicine. 2020; 151: 7-25.
- J Lee, et al. Quantity, size distribution, and characteristics of cough-generated aerosol produced by patients with an upper respiratory tract infection. Aerosol and Air Quality Research. 2019; 19: 840-853.
- SM Mack, AK Madl, KE Pinkerton. Respiratory health effects of exposure to ambient particulate matter and bioaerosols. Comprehensive physiology. 2019; 10: 1.
- RS Juan, et al. Multi-scale spatial heterogeneity enhances particle clearance in airway ciliary arrays. Nature Physics. 2020; 16: 958-964.
- CA Pope III, JB Muhlestein HT, May DG, Renlund JL, Anderson, BD Horne, et al. Ischemic heart disease events triggered by short-term exposure to fine particulate air pollution. Circulation. 2006; 114: 2443-2448.
- K Torén, IA Bergdahl, T Nilsson, B Järvholm. Occupational exposure to particulate air pollution and mortality due to ischaemic heart disease and cerebrovascular disease. Occupational and environmental medicine. 2007; 64: 515-519.
- J Wedel, P Steinmann, M Štrakl, M Hriberšek, J Ravnik, et al. Can CFD establish a connection to a milder COVID-19 disease in younger people? Aerosol deposition in lungs of different age groups based on Lagrangian particle tracking in turbulent flow. Computational Mechanics. 2021; 67: 1497-1513.
- K Ahookhosh, S Yaqoubi, M Mohammadpourfard, H Hamishehkar, H Aminfar, et al. Experimental investigation of aerosol deposition through a realistic respiratory airway replica: An evaluation for MDI and DPI performance. International journal of pharmaceutics. 2019; 566: 157-172.
- AA Aly, SB Deris, N Zaki, et al. Research review for digital image segmentation techniques. International Journal of Computer Science & Information Technology. 2011; 3: 99.
- A Işın, C Direkoğlu, M Şah. Review of MRI-based brain tumor image segmentation using deep learning methods. Procedia Computer Science. 2016; 102: 317-324.
- H Zhang, JE Fritts, SA Goldman. Image segmentation evaluation: A survey of unsupervised methods,” computer vision and image understanding. 2008; 110: 260-280.
- A Aghamohammadi, R Ranjbarzadeh, F Naiemi, M Mogharrebi, S Dorosti, M Bendechache. TPCNN: Two-path convolutional neural network for tumor and liver segmentation in CT images using a novel encoding approach. Expert Systems with Applications. 2021; 183: 115406.
- SB Saadi, et al. Osteolysis: A literature review of basic science and potential computer-based image processing detection methods. Computational Intelligence and Neuroscience. 2021; 2021.
- S Abbasi, M Rezaeian. Visual object tracking using similarity transformation and adaptive optical flow. Multimedia Tools and Applications. 2021; 80: 33455-33473.
- B Wu, R Nevatia. Detection and tracking of multiple, partially occluded humans by bayesian combination of edgelet based part detectors. International Journal of Computer Vision. 2007; 75: 247-266.
- L Ding, X Xu, Y Cao, G Zhai, F Yang, et al. Detection and tracking of infrared small target by jointly using SSD and pipeline filter. Digital Signal Processing. 2021; 110: 102949.
- A Hojatimalekshah, et al. Tree canopy and snow depth relationships at fine scales with terrestrial laser scanning. The Cryosphere. 2021; 15: 2187-2209.
- R Ranjbarzadeh, SB Saadi, A Amirabadi. LNPSS: SAR image despeckling based on local and non-local features using patch shape selection and edges linking. Measurement. 2020; 164: 107989.
- ZA Sahib, ON Uçan, MA Talab, MT Alnaseeri, AH Mohammed, et al. Hybrid Method Using EDMS & Gabor for Shape and Texture in 2020 International Congress on Human-Computer Interaction. Optimization and Robotic Applications (HORA). 2020; IEEE. 1-6.
- J Cai. Segmentation and diagnosis of liver carcinoma based on adaptive scale-kernel fuzzy clustering model for CT images. Journal of Medical Systems. 2019; 43: 1-11.
- H Hadizadeh. Multi-resolution local Gabor wavelets binary patterns for gray-scale texture description. Pattern Recognition Letters. 2015; 65: 163-169.
- R Ranjbarzadeh, A Bagherian Kasgari, S Jafarzadeh Ghoushchi, S Anari, M Naseri, et al. Brain tumor segmentation based on deep learning and an attention mechanism using MRI multi-modalities brain images. Scientific Reports. 2021; 11: 1-17.
- S Karthick, K Sathiyasekar, A Puraneeswari. A survey based on region based segmentation. International Journal of Engineering Trends and Technology. 2014; 7: 143-147.
- DD Patil, SG Deore. Medical image segmentation: A review. International Journal of Computer Science and Mobile Computing. 2013; 2: 22-27.
- R Krithiga, P Geetha. Breast cancer detection, segmentation and classification on histopathology images analysis: A systematic review, Archives of Computational Methods in Engineering. 2021; 28: 2607-2619.
- R Ranjbarzadeh, et al. Lung infection segmentation for COVID-19 pneumonia based on a cascade convolutional network from CT images. BioMed Research International. 2021; 2021.
- K Somasundaram, T Genish, et al. An atlas based approach to segment the hippocampus from MRI of human head scans for the diagnosis of Alzheimers disease. International Journal of Computational Intelligence and Informatics. 2015; 5.
- S Aleem, T Kumar, S Little, M Bendechache, R Brennan, et al. Random Data Augmentation based Enhancement: AGeneralized Enhancement Approach for Medical Datasets. 2022.
- SM Mousavi, A Asgharzadeh Bonab, R Ranjbarzadeh. Time-frequency analysis of EEG signals and GLCM features for depth of anesthesia monitoring. Computational Intelligence and Neuroscience. 2021; 2021.
- A Valizadeh, S Jafarzadeh Ghoushchi, R Ranjbarzadeh, Y Pourasad, et al. Presentation of a segmentation method for a diabetic retinopathy patient’s fundus region detection using a convolutional neural network, Computational Intelligence and Neuroscience. 2021; 2021.
- Z Xu, FR Sheykhahmad, N Ghadimi, N Razmjooy, et al. Computer-aided diagnosis of skin cancer based on soft computing techniques. Open Medicine. 2020; 15: 860-871.
- H Yao, X Zhang, X Zhou, S Liu, et al. Parallel structure deep neural network using CNN and RNN with an attention mechanism for breast cancer histology image classification. Cancers. 2019; 11: 1901.
- G Chen, et al. Fully convolutional neural network with augmented atrous spatial pyramid pool and fully connected fusion path for high resolution remote sensing image segmentation. Applied Sciences. 2019; 9: 1816.
- R Yamashita, M Nishio, R. Do, Gian K Togashi. Convolutional neural networks: An overview and application in radiology. Insights Imag. 2018; 9: 611-629.
- ER Weibel. Geometry and dimensions of airways of conductive and transitory zones in Morphometry of the human lung: Springer. 1963. 110-135.
- N Karimi, RR Kondrood, T Alizadeh, et al. An intelligent system for quality measurement of Golden Bleached raisins using two comparative machine learning algorithms. Measurement. 2017; 107: 68-76.
- R Ranjbarzadeh, et al. Nerve optic segmentation in CT images using a deep learning model and a texture descriptor. Complex & Intelligent Systems. 2022; 1-15.
- R Arya, E Vimina. An evaluation of local binary descriptors for facial emotion classification, in Innovations in Computer Science and Engineering: Springer. 2020; 195-205.
- H Chen, M Gao, K Ricanek, W Xu, B Fang, et al. A novel race classification method based on periocular features fusion. International Journal of Pattern Recognition and Artificial Intelligence. 2017; 31: 1750026.
- C Rupprecht, E Huaroc, M Baust, N Navab. Deep active contours, arXiv preprint arXiv: 1607.05074, 2016.
- Q Ye and D. Doermann. Text detection and recognition in imagery: A survey. IEEE transactions on pattern analysis and machine intelligence. 2014; 7: 1480-1500.
- Y Xu, X Yang, H Ling, H Ji. A new texture descriptor using multifractal analysis in multi-orientation wavelet pyramid, in 2010 IEEE Computer Society Conference on Computer Vision and Pattern Recognition. 2010: IEEE, 161-168.
- YC MacNab. Some recent work on multivariate Gaussian Markov random fields. Test. 2018; 27: 497-541.
- D Gogolewski. Fractional spline wavelets within the surface texture analysis. Measurement. 2021; 179; 109435.
- T Jabid, MH Kabir, O Chae. Local Directional Pattern (LDP)–A robust image descriptor for object recognition. In 2010 7th IEEE international conference on advanced video and signal based surveillance. 2010: IEEE, 482-487.
- M Barstugan, U Ozkaya, S Ozturk. Coronavirus (covid-19) classification using ct images by machine learning methods. arXiv preprint arXiv: 2003.09424, 2020.
- S Zhou, Y Chen, D Zhang, J Xie, Y Zhou, et al. Classification of surface defects on steel sheet using convolutional neural networks. Mater. Technol. 2017; 51: 123-131.
- F Milletari, N Navab, SA Ahmadi. V-net: Fully convolutional neural networks for volumetric medical image segmentation. In 2016 fourth international conference on 3D vision (3DV). 2016: IEEE. 565-571.
- Y Zhu, J Du. Textmountain: Accurate scene text detection via instance segmentation. Pattern Recognition, 2021; 110: 107336.
- B McFee, J Salamon, JP Bello. Adaptive pooling operators for weakly labeled sound event detection. IEEE/ACM Transactions on Audio, Speech, and Language Processing. 2018; 26: 2180-2193.
- I Sutskever, J Martens, G Dahl, G Hinton. On the importance of initialization and momentum in deep learning, in International conference on machine learning. 2013: PMLR, 1139-1147.
- T Adefarati and R. Bansal. Integration of renewable distributed generators into the distribution system: A review. IET Renewable Power Generation. 2016; 10: 873-884.
- R Saouli, M Akil, R Kachouri. Fully automatic brain tumor segmentation using end-to-end incremental deep neural networks in MRI images. Computer methods and programs in biomedicine. 2018; 166: 39-49.
- A Chandio, Y Shen, M Bendechache, I Inayat, T Kumar, et al. AUDD: Audio Urdu digits dataset for automatic audio Urdu digit recognition. Applied Sciences. 2021; 11: 8842.
- S Fekri Ershad. Bark texture classification using improved local ternary patterns and multilayer neural network. Expert Systems with Applications. 2020; 158: 113509.
- P Kavitha, K Vijaya. Fuzzy local ternary pattern and skin texture properties based counter measure against face spoofing in biometric systems. Computational Intelligence. 2021; 37: 559-577.