
Journal of Clinical Images and Medical Case Reports
ISSN 2766-7820
Research Article - Open Access, Volume 4
Investigation of a novel intracardiac flow parameter using blood speckle imaging
Megan Laughlin1; Ethan Potts1; R Thomas Collins2; Elijah Bolin3,4; Hanna Jensen5; Paul Millett6; Morten Jensen1*
1University of Arkansas, Department of Biomedical Engineering, Fayetteville, AR, USA.
2University of Kentucky College of Medicine, Department of Pediatrics, Lexington, KY, USA.
3University of Arkansas for Medical Sciences, Department of Pediatrics, Little Rock, AR, USA.
4Arkansas Children’s Research Institute, Little Rock, AR, USA.
5University of Arkansas for Medical Sciences, Department of Surgery, Little Rock, AR, USA.
6University of Arkansas, Department of Mechanical Engineering, Fayetteville, AR, USA.
*Corresponding Author : Morten Jensen, PhD
University of Arkansas, Department of Biomedical Engineering, Fayetteville, AR, USA.
Ph: 479-575-4667;
Email: mojensen@uark.edu
Received : Dec 19, 2022
Accepted : Dec 19, 2022
Published : Jan 16, 2023
Archived : www.jcimcr.org
Copyright : © Jensen M (2023).
Abstract
Purpose: Intracardiac flow analysis utilizing non-invasive imaging methods is an increasingly attractive approach to evaluate cardiac function. Ultrasound-based modalities offer a low-cost bedside method to visualize and quantify intracardiac flow dynamics but are currently limited to primarily 2D. This study aims to propose and evaluate a new, novel parameter based on known healthy flow patterns in the Left Ventricle (LV) and 2D velocity field data.
Methods: Blood Speckle Imaging (BSI) was performed on three pediatric patients, one with a structurally normal heart and two with Ventricular Septal Defect (VSD), to obtain the velocity fields of LV flow. Based on the presence of an ellipse-shaped vortex in healthy LV flow, an ellipse with an aspect ratio of 1.7 was used to determine the theoretical angle of flow (θT) at each point in the region of interest (ROI). Angle deviation (θD) was calculated by taking the absolute difference between θT and the measured angle (θM), and the mean θD determined for the entire ROI. Segmental analysis was also performed to investigate potential differences in the mean θD for the four ellipse quadrants.
Results: Patients with VSD exhibited higher θD (75.2 ± 22.3o and 77.6 ± 10.7o) compared to the structurally normal (69.2 ± 16.0o). Segmental analysis demonstrated greater θD in the upper quadrants (Q1/Q2) of the ellipse ROI, which indicates that flow strays from an elliptical path near the mitral valve and left ventricular outflow tract. For the lower quadrants (Q3/Q4), the lowest θD was observed for the structurally normal patient vs. VSDs.
Conclusion: Angle deviation is proposed as a novel flow parameter for evaluation of LV function using 2D ultrasound-based imaging methods. Future work will include an expansion of the patient population and a focus on structurally normal hearts to determine reference values for comparison to cases of cardiac dysfunction.
Keywords: Intracardiac flow; Left ventricular function; Blood speckle imaging; Congenital heart disease.
Citation: Laughlin M, Potts E, Collins RT, Bolin E, Jensen M, et al. Investigation of a novel intracardiac flow parameter using blood speckle imaging research article. J Clin Images Med Case Rep. 2023; 4(1): 2244.
Introduction
The analysis of intracardiac flows as an approach to evaluate cardiac function continues to grow in interest alongside the emergence of new non-invasive cardiovascular imaging techniques [1-3]. These modalities allow for the detailed visualization and quantification of complex flow dynamics within the cardiac chambers. During diastolic filling, blood enters the Left Ventricle (LV) through the mitral valve and forms vortices that redirect blood toward the left Ventricular Outflow Tract (LVOT) for ejection. Vortices play a key role in the preservation of kinetic energy during the cardiac cycle and their characteristics have been identified as an indicator of cardiac health and function [4-6].
Numerous vortex characteristics and flow parameters have been investigated, such as location and area of the vortex, as well as kinetic energy, energy loss, and circulation [1-7]. While changes in these parameters have been linked to cardiac dysfunction and specific cardiovascular diseases, including cases of Congenital Heart Disease (CHD), their clinical use remains limited [8]. Ultrasound-based imaging modalities are the preferred method for flow analysis due to their low-cost, wide availability, and bedside nature. However, there are often spatial limitations regarding 2D vs. 3D, which may pose challenges with clinical applicability due to blood flow being inherently 3D. This presents an opportunity for the development of a new, novel intracardiac flow parameter based on healthy vortex flow patterns and 2D velocity field data.
In a healthy LV, the vortex is stable and ellipse-shaped [5-9]. This vortex becomes increasingly unstable and circular with LV adaptation, which is believed to induce further remodeling of cardiac tissue. Therefore, it is hypothesized that blood flow exhibits a predictable pattern according to an ellipse, its direction of which can be determined by the tangent to each point along the ellipse. This predictable, or theoretical, direction can then be compared to that measured by a 2D ultrasound-based imaging method to quantify what is proposed as a new LV flow parameter: angle deviation.
The purpose of this study was to present and evaluate angle deviation as a new, novel flow parameter for the evaluation of LV function. It was hypothesized that a higher angle deviation would be observed in cases of cardiac dysfunction or disease as opposed to structurally normal hearts.
Materials and methods
Blood Speckle Imaging (BSI)
BSI is a new angle-independent, ultrasound-based imaging modality that tracks the speckle signal from blood cells across multiple high-speed imaging frames to obtain a velocity field [8,10-12]. Velocities have been validated to a depth of 8 cm and therefore it is ideal for pediatric applications [10]. Three patients of ages < 12 months were included: one with a structurally normal heart and two with Ventricular Septal Defect (VSD). Scans were performed using a Vivid E95 ultrasound machine with BSI software (GE Vingmed Ultrasound, Horten, Norway) and 5 MHz linear probe for a minimum of two cardiac cycles in the apical 2- and 4-chamber views. Data processing to obtain the velocity fields was performed offline by GE Medical.
Angle deviation
To determine the theoretical angle at each point in the vortex flow field, an ellipse with an aspect ratio of 1.7 was used to define a Region Of Interest (ROI) and as the basis for calculation. This aspect ratio aligns with the ratio of long- to short-axis length observed for the pediatric left ventricle [13]. The slope of the tangent at a point [x1,y1] on an ellipse with no angle of rotation is given by:
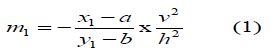
where [a,b] = center point, h = major axis, and v = minor axis of the ellipse. To determine the slope of the tangent at point [x2,y2] on an ellipse rotated θ degrees, [x1,y1] is first expressed in terms of [x2,y2] and θ to give the slope:
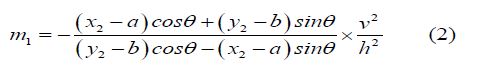
Using an arbitrary point [x2,y2] on the rotated ellipse, the slope of the rotated tangent line is:
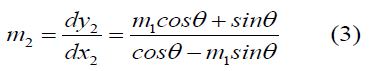
where the inverse tangent of the slope gives the theoretical angle (θT), or direction, from -90 to 90O.
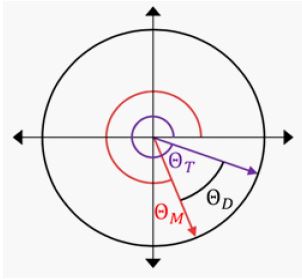
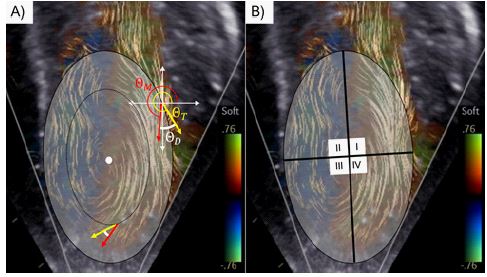
For comparison to the velocity directions from BSI, or the measured angle (θM), the theoretical angles were converted to a range of 0 to 360O. The flow velocity angle deviation (θD) at a single point was then calculated by taking the absolute difference between θT and θM (Figure 1) to give the equation:

To determine θD for an entire ROI (Figure 2A), concentric ellipses are used to obtain θT at all points in the flow field and the mean calculated.
Data analysis
A custom MATLAB program was developed to evaluate angle deviation using BSI velocity field data. The time points at which data was analyzed were chosen based on when the mitral valve was visually determined to be fully opened, and a well-formed vortex was present in the LV cavity. This time-point is approximately mid-diastole. The mean θD was calculated for the entire ROI for each patient scan, which was averaged over all scans to provide an overall mean θD for each patient.
Segmental analysis was performed to evaluate the potential influence of nearby cardiac structures on flow patterns and corresponding θD. For example, flow can be observed to deviate from an elliptical path in Figure 2 as blood is redirected toward the LVOT and therefore a higher θD is to be expected in this area of the flow field. This analysis was done by segmenting the LV into four quadrants (Figure 2B), consistent with the coordinate plane system, and evaluating the mean θD for each quadrant.
Results
For the entire ellipse ROI, patients with VSD exhibited higher θD (75.2 ± 22.3O and 77.6 ± 10.7O) compared to the structurally normal patient (69.2 ± 16.0O). Segmental analysis demonstrated the largest θD in the upper quadrants of the ellipse ROI (Q1/Q2) ranging from 69.3-171.8O for Q1 to 31.8-112.0O for Q2. The lowest θD, which also spanned a smaller range,were observed for the lower quadrants (Q3/Q4) with 44.0-72.9O for Q3 and 53.3-73.9O for Q4.
Table 1: Mean flow velocity angle deviations (θD). The lowest θD for the entire elliptical region of interest (ROI) and Q1/Q3/Q4 was observed for the structurally normal patient. Segmental analysis demonstrated the highest θD in Q1/Q2, which indicates that flow strays from an elliptical flow near the mitral valve and left ventricular outflow tract.
| θD (°) | |||
|---|---|---|---|
| Patient 1(VSD) | Patient 2(VSD) | Patient 3(Normal) | |
| All | 75.2 ± 22.3 | 77.6 ± 10.7 | 69.2 ± 16.0 |
| Q1 | 94.4 ± 97.2 | 171.8 ± 41.7 | 69.3 ± 43.2 |
| Q2 | 75.1 ± 35.5 | 31.8 ± 12.2 | 112.0 ± 33.3 |
| Q3 | 57.8 ± 16.8 | 72.9 ± 77.4 | 44.0 ± 21.7 |
| Q4 | 73.9 ± 28.2 | 55.7 ± 25.7 | 55.7 ± 25.7 |
Focusing on Q3 and Q4 due to the lower θd and therefore more ellipse-shaped flow, the lowest values were observed for the structurally normal patient (44.0 ± 21.7O for Q3 and 53.3 ± 25.5O for Q4). The measured θD for VSD patients were 57.8 ± 16.8O / 72.9 ± 77.4 for Q3 and 73.9 ± 28.2O / 55.7 ± 25.7O for Q4. The standard deviations (SD) in the lower quadrants were comparable for all patients with the exception of an extremely high SD for a VSD patient in Q3.
Discussion
Angle deviation, or θD, has been proposed and evaluated as a new, novel intracardiac flow parameter based on healthy ellipse-shaped flow in the LV. BSI data from three pediatric patients demonstrated the highest θD for patients with VSD. These results indicate that θD may increase alongside disease progression and therefore be a useful indicator for evaluating cardiac function. The θd values were higher than expected which may indicate the need for further refinement of the algorithm such as adjustment of the aspect ratio used for the ellipse and placement of the ROI within the flow field. A focus on structurally normal hearts may provide greater understanding of how the proposed parameter and its evaluation can be optimized before moving to diseased cases where flow is less predictable.
Segmental analysis indicated that flow does not follow an ellipse-shaped pattern in all areas of the ROI and is influenced by nearby cardiac structures. This is primarily relevant during filling as the transmitral jet enters the LV or ejection into the LVOT. Therefore, θD will be most applicable for evaluating flow in the lower quadrants of the ROI. Using Q3/Q4, this study demonstrates that patients with VSD exhibited higher θD based primarily on 2D ultrasound-based imaging data which may expand the clinical applicability of intracardiac flow analysis.
A primary limitation of this study is that direct synchronization of BSI and ECG data is not available from the ultrasound machine. This presents difficulties with analyzing the velocity fields at distinct time points in the cardiac cycle. Techniques such as tracking of the mitral valve leaflets or LV wall may be employed in the algorithm to overcome this limitation and improve upon the method of visual determination used in this study.
Future work will include expansion of the patient population, including both structurally normal and cases of CHD, with an emphasis on structurally normal hearts in order to define reference values for comparison to diseased states.
Declarations
Funding: This research was funded by the University of Arkansas for Medical Sciences and the Arkansas Research Alliance.
Conflicts of interest: The authors declare no potential conflicts of interest.
Ethics approval: This study was approved by the Institutional Review Board of the University of Arkansas for Medical Sciences. All procedures adhered to the ethical standards set forth by the Declaration of Helsinki.
Consent to participate: Informed consent was obtained from legal guardians of all participants included in the study.
Acknowledgments: The authors thank GE Medical for the processing of BSI data. Debby Grisby provided echocardiography support for this study.
References
- Mele D, Smarrazzo V, Pedrizzetti G, Capasso F, Pepe M, et al. Intracardiac Flow Analysis: Techniques and Potential Clinical Applications. J Am Soc Echocardiogr. 2019; 32: 319-332.
- Rodriguez Muñoz D, Markl M, Moya Mur JL, Barker A, Fernández-Golfín C, et al. Intracardiac flow visualization: current status and future directions. European Heart Journal - Cardiovascular Imaging. 2013; 14: 1029-1038.
- Hong GR, Kim M, Pedrizzetti G, Vannan MA. Current clinical application of intracardiac flow analysis using echocardiography. J Cardiovasc Ultrasound. 2013; 21: 155-162.
- Kim IC, Hong GR. Intraventricular Flow: More than Pretty Pictures. Heart Fail Clin. 2019; 15: 257-265.
- Pedrizzetti G, La Canna G, Alfieri O, Tonti G. The vortex--an early predictor of cardiovascular outcome? Nature reviews Cardiology. 2014; 11: 545-553.
- de Waal K, Crendal E, Boyle A. Left ventricular vortex formation in preterm infants assessed by blood speckle imaging. Echocardiography. 2019; 36: 1364-1371.
- Chen P, van Sloun RJG, Turco S, Wijkstra H, Filomena D, et al. Blood flow patterns estimation in the left ventricle with low-rate 2D and 3D dynamic contrast-enhanced ultrasound. Comput Methods Programs Biomed. 2021; 198: 105810.
- Borrelli N, Avesani M, Sabatino J, Ibrahim A, Josen M, et al. Blood speckle imaging: A new echocardiographic approach to study fluid dynamics in congenital heart disease. International Journal of Cardiology Congenital Heart Disease. 2021; 2: 100079.
- Pedrizzetti G, Domenichini F. Nature optimizes the swirling flow in the human left ventricle. Phys Rev Lett. 2005; 95: 108101.
- Nyrnes SA, Fadnes S, Wigen MS, Mertens L, et al. Blood speckle-tracking based on high-frame rate ultrasound imaging in pediatric cardiology. J Am Soc Echocardiogr. 2020; 33: 493-503.e5.
- Mawad W, Lovstakken L, Fadnes S, Gronli T, Segers P, et al. Right Ventricular Flow Dynamics in Dilated Right Ventricles: Energy Loss Estimation Based on Blood Speckle Tracking Echocardiography-A Pilot Study in Children. Ultrasound Med Biol. 2021; 47: 1514-1527.
- Cantinotti M, Marchese P, Koestenberger M, Giordano R, Santoro G, et al. Intracardiac flow visualization using high-frame rate blood speckle tracking echocardiography: Illustrations from infants with congenital heart disease. Echocardiography. 2021; 38: 707-715.
- Regen DM, Graham TP, Wyse RK, Deanfield J, Franklin RC. Left-ventricular cavity dimensions in children with normal and dilated hearts. Pediatr Cardiol. 1988; 9: 17-24.